Copyright
©2011 Baishideng Publishing Group Co.
World J Gastroenterol. Feb 28, 2011; 17(8): 968-975
Published online Feb 28, 2011. doi: 10.3748/wjg.v17.i8.968
Published online Feb 28, 2011. doi: 10.3748/wjg.v17.i8.968
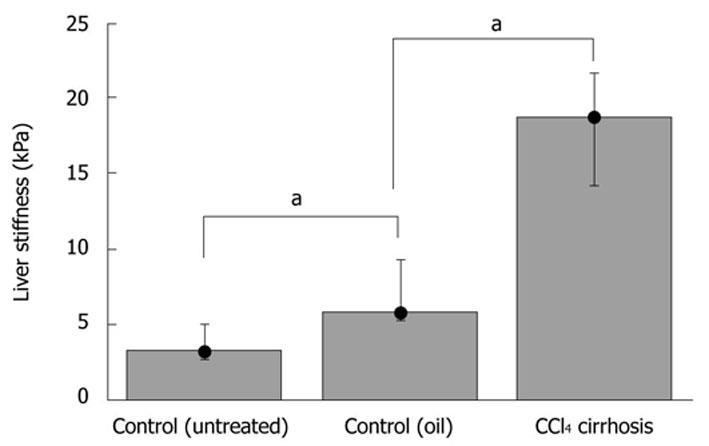
Figure 4 Bar plot showing median liver stiffness in control (untreated vs oil-treated) and CCl4-induced fibrosis.
Liver stiffness is expressed in kPa. Whiskers indicate the extent of the data. The difference between the groups is significant (aP≤ 0.05, Mann-Whitney).
- Citation: Bastard C, Bosisio MR, Chabert M, Kalopissis AD, Mahrouf-Yorgov M, Gilgenkrantz H, Mueller S, Sandrin L. Transient micro-elastography: A novel non-invasive approach to measure liver stiffness in mice. World J Gastroenterol 2011; 17(8): 968-975
- URL: https://www.wjgnet.com/1007-9327/full/v17/i8/968.htm
- DOI: https://dx.doi.org/10.3748/wjg.v17.i8.968


