Copyright
©2011 Baishideng Publishing Group Co.
World J Gastroenterol. Feb 28, 2011; 17(8): 1076-1081
Published online Feb 28, 2011. doi: 10.3748/wjg.v17.i8.1076
Published online Feb 28, 2011. doi: 10.3748/wjg.v17.i8.1076
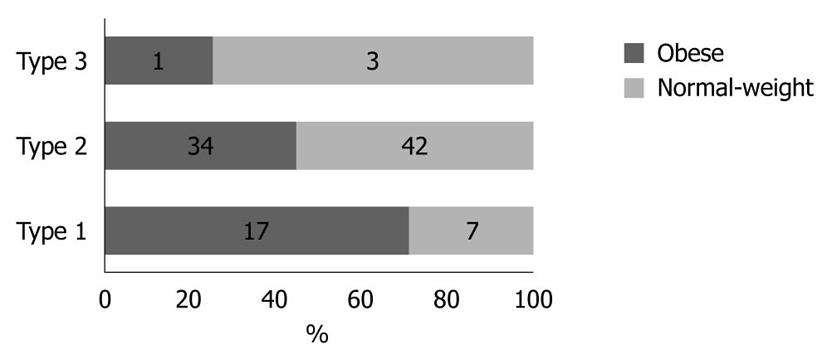
Figure 2 Stool form scale in obese and normal-weight groups.
A substantial difference was observed in the stool form scale between the obese and normal-weight groups (U = 1062, P < 0.05). A greater number of participants in the normal-weight group demonstrated a type 2 (stools exhibiting a smooth snake or sausage shape with cracks in the surface) and type 3 (stools appearing in separate, hard lumps or even in a nut-like form) stool form compared with their obese counterparts (42 vs 34, 3 vs 1).
- Citation: Zuo HJ, Xie ZM, Zhang WW, Li YR, Wang W, Ding XB, Pei XF. Gut bacteria alteration in obese people and its relationship with gene polymorphism. World J Gastroenterol 2011; 17(8): 1076-1081
- URL: https://www.wjgnet.com/1007-9327/full/v17/i8/1076.htm
- DOI: https://dx.doi.org/10.3748/wjg.v17.i8.1076


