Copyright
©2011 Baishideng Publishing Group Co.
World J Gastroenterol. Feb 28, 2011; 17(8): 1045-1050
Published online Feb 28, 2011. doi: 10.3748/wjg.v17.i8.1045
Published online Feb 28, 2011. doi: 10.3748/wjg.v17.i8.1045
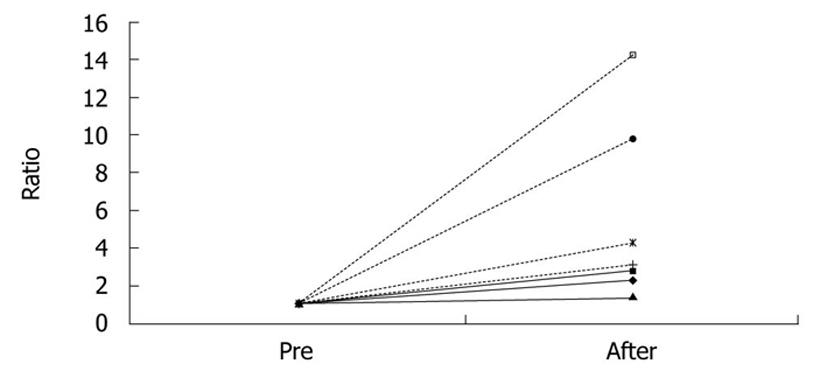
Figure 2 Tumor size variation.
Solid lines show the size variation of the sorafenib-treated group. Interrupted lines show the size variation of the control group. The control group showed greater tumor enlargement than the sorafenib group did.
- Citation: Yoshida K, Hirokawa T, Moriyasu F, Liu L, Liu GJ, Yamada M, Imai Y. Arterial-phase contrast-enhanced ultrasonography for evaluating anti-angiogenesis treatment: A pilot study. World J Gastroenterol 2011; 17(8): 1045-1050
- URL: https://www.wjgnet.com/1007-9327/full/v17/i8/1045.htm
- DOI: https://dx.doi.org/10.3748/wjg.v17.i8.1045


