Copyright
©2011 Baishideng Publishing Group Co.
World J Gastroenterol. Feb 14, 2011; 17(6): 796-803
Published online Feb 14, 2011. doi: 10.3748/wjg.v17.i6.796
Published online Feb 14, 2011. doi: 10.3748/wjg.v17.i6.796
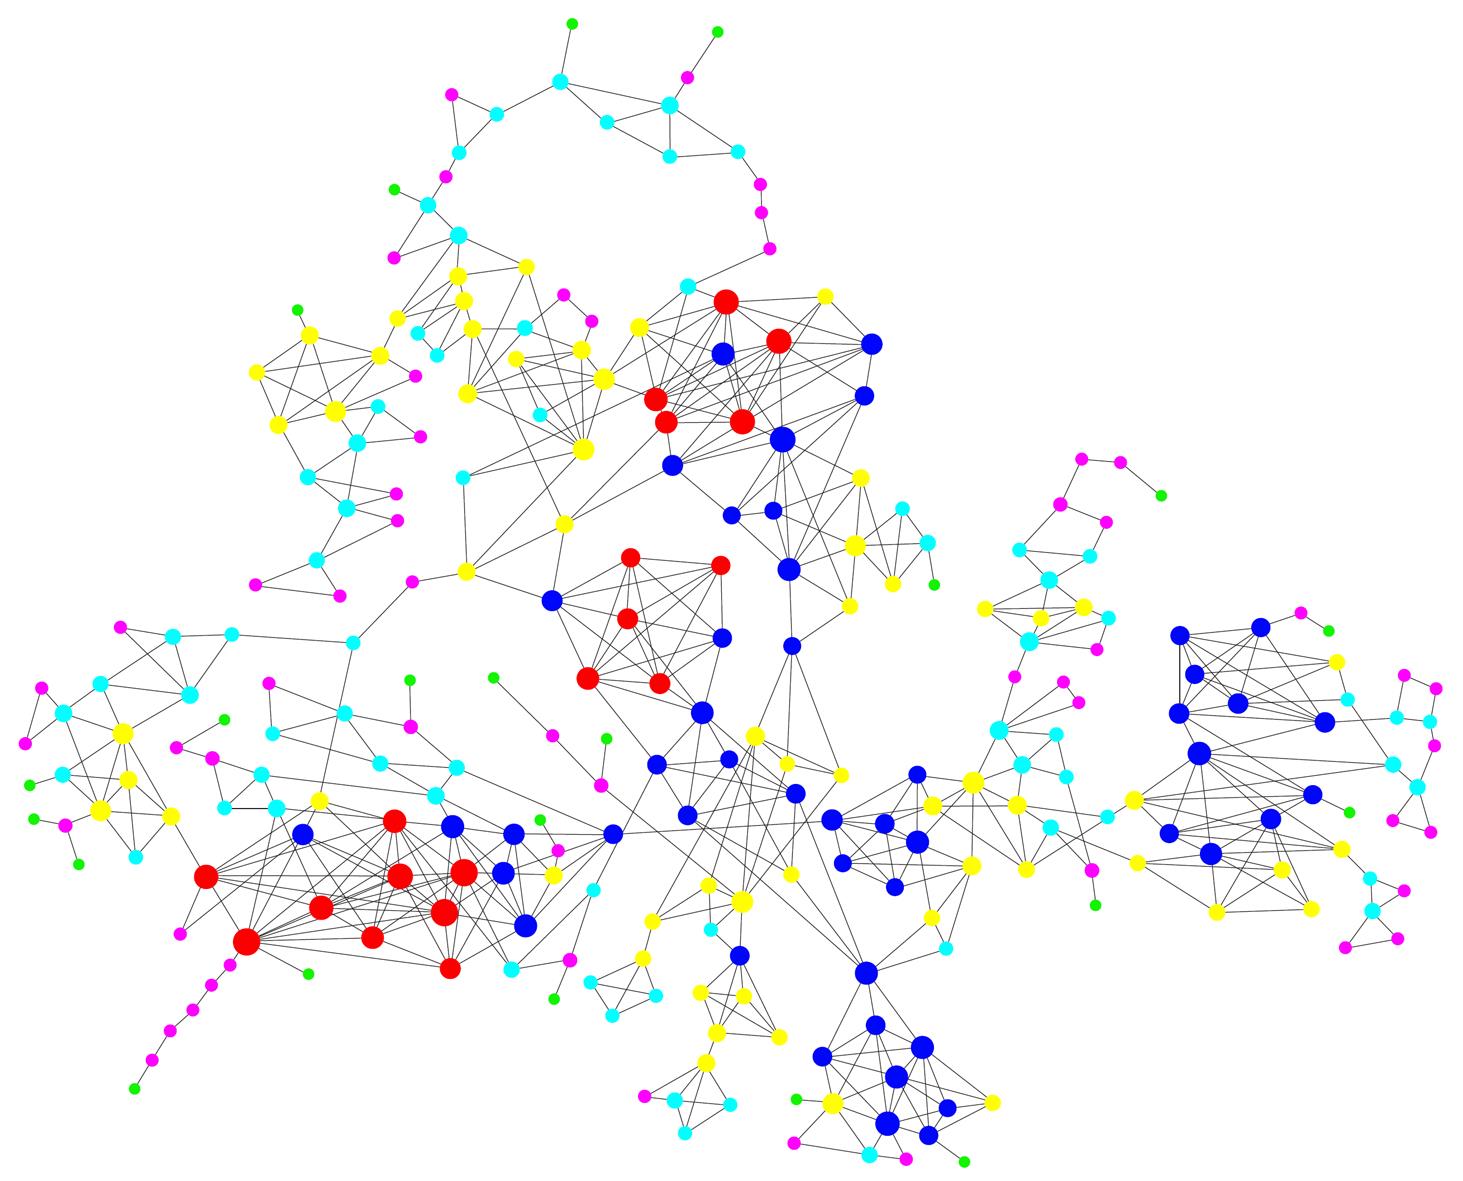
Figure 2 Dynamic gene networks constructed showing the key regulators that may play a central role in the pathogenesis of biliary atresia.
Circles indicate genes in the 4 expression profiles, solid lines indicate direct interactions, and size of circles indicates their interactions with other molecules. Coloring is classified according to the k core, and red indicates high k core.
- Citation: Zhao R, Li H, Shen C, Zheng S. RRAS: A key regulator and an important prognostic biomarker in biliary atresia. World J Gastroenterol 2011; 17(6): 796-803
- URL: https://www.wjgnet.com/1007-9327/full/v17/i6/796.htm
- DOI: https://dx.doi.org/10.3748/wjg.v17.i6.796


