Copyright
©2011 Baishideng Publishing Group Co.
World J Gastroenterol. Dec 28, 2011; 17(48): 5267-5273
Published online Dec 28, 2011. doi: 10.3748/wjg.v17.i48.5267
Published online Dec 28, 2011. doi: 10.3748/wjg.v17.i48.5267
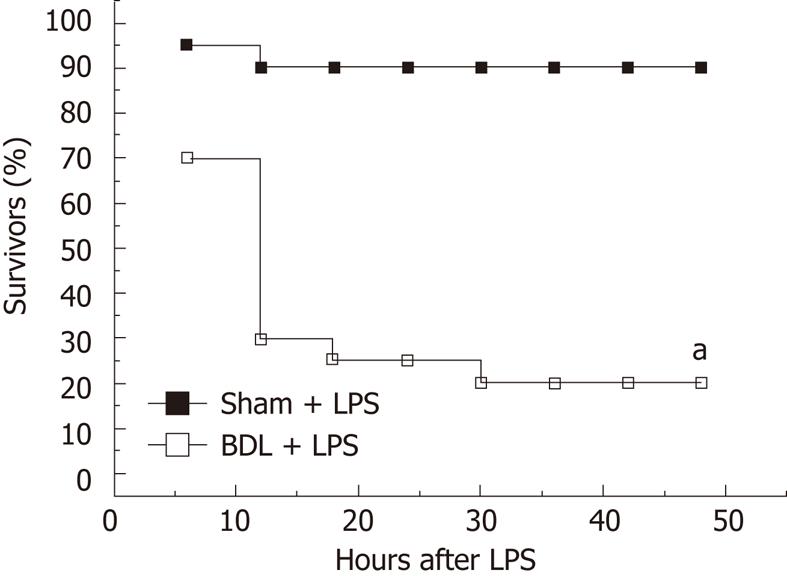
Figure 2 Survival rates of rats after administration of lipopolysaccharide (3 mg/kg, i.
p.). The survival curve was estimated by the Kaplan-Meier method and the log-rank method was used to compare differences in survival rates between groups (n = 20). aP < 0.01 for bile duct ligation group vs sham group. BDL: Bile duct ligation; LPS: Lipopolysaccharide.
- Citation: Lv X, Song JG, Li HH, Ao JP, Zhang P, Li YS, Song SL, Wang XR. Decreased hepatic peroxisome proliferator-activated receptor-γ contributes to increased sensitivity to endotoxin in obstructive jaundice. World J Gastroenterol 2011; 17(48): 5267-5273
- URL: https://www.wjgnet.com/1007-9327/full/v17/i48/5267.htm
- DOI: https://dx.doi.org/10.3748/wjg.v17.i48.5267


