Copyright
©2011 Baishideng Publishing Group Co.
World J Gastroenterol. Dec 14, 2011; 17(46): 5110-5116
Published online Dec 14, 2011. doi: 10.3748/wjg.v17.i46.5110
Published online Dec 14, 2011. doi: 10.3748/wjg.v17.i46.5110
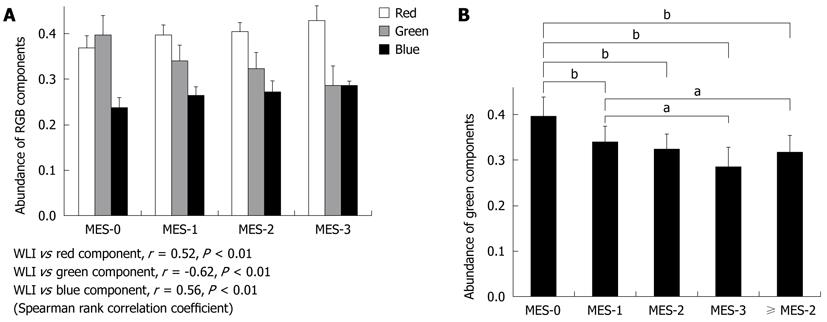
Figure 3 Comparison of overall mucosal inflammation on white light imaging and the abundance of RGB color components on autofluorescence imaging.
A: The green color component corresponds most often with sites of mucosal inflammation in different colonoscopy images (according to Spearman rank correlation coefficient); B: There are significant differences in the green color component values between Mayo endoscopic subscore (MES)-0 and MES-1 (bP < 0.01), between MES-0 and MES-2 (bP < 0.01), between MES-0 and MES-3 (bP < 0.01), between MES-1 and MES-3 (aP < 0.05), between MES-0 and ≥ MES-2 (bP < 0.01) and between MES-1 and ≥ MES-2 (aP < 0.05), but not between MES-1 and MES-2 or between MES-2 and MES-3 (Tukey-Kramer multiple comparison test). WLI: White light imaging.
- Citation: Osada T, Arakawa A, Sakamoto N, Ueyama H, Shibuya T, Ogihara T, Yao T, Watanabe S. Autofluorescence imaging endoscopy for identification and assessment of inflammatory ulcerative colitis. World J Gastroenterol 2011; 17(46): 5110-5116
- URL: https://www.wjgnet.com/1007-9327/full/v17/i46/5110.htm
- DOI: https://dx.doi.org/10.3748/wjg.v17.i46.5110


