Copyright
©2011 Baishideng Publishing Group Co.
World J Gastroenterol. Dec 14, 2011; 17(46): 5075-5082
Published online Dec 14, 2011. doi: 10.3748/wjg.v17.i46.5075
Published online Dec 14, 2011. doi: 10.3748/wjg.v17.i46.5075
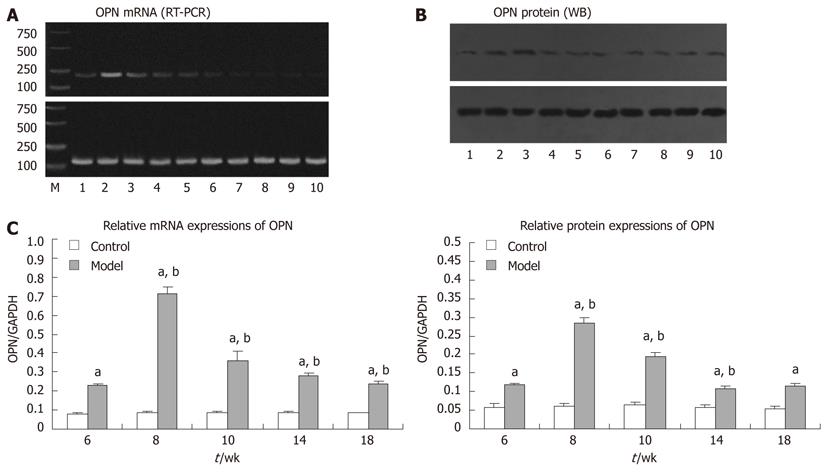
Figure 4 Profiles of osteopontin mRNA (RT-PCR) and protein (Western blotting) expression.
No. 1-5 represent the model group at week 6, 8, 10, 14, and 18, respectively; No. 6-10 represent the control group at week 6, 8, 10, 14, and 18, respectively. A: Expression of osteopontin and GAPDH mRNA over time, the 100-bp GAPDH mRNA fragment was used as an internal control; B: Expression of osteopontin and GAPDH protein over time, the 37-kDa GAPDH band was used as an internal control; C: The IOD of osteopontin/GAPDH was expressed as the mean ± SD. M: Marker; n = 10 at each time. OPN: Osteopontin; RT-PCR: Reverse transcription polymerase chain reaction; GAPDH: Glyceraldehyde-3-phosphate dehydrogenase; IOD: Integral optical density. aP < 0.05 vs control; bP < 0.05 vs previous.
-
Citation: Chen BL, Zhang GY, Yuan WJ, Wang SP, Shen YM, Yan L, Gu H, Li J. Osteopontin expression is associated with hepatopathologic changes in
Schistosoma japonicum infected mice. World J Gastroenterol 2011; 17(46): 5075-5082 - URL: https://www.wjgnet.com/1007-9327/full/v17/i46/5075.htm
- DOI: https://dx.doi.org/10.3748/wjg.v17.i46.5075


