Copyright
©2011 Baishideng Publishing Group Co.
World J Gastroenterol. Dec 14, 2011; 17(46): 5075-5082
Published online Dec 14, 2011. doi: 10.3748/wjg.v17.i46.5075
Published online Dec 14, 2011. doi: 10.3748/wjg.v17.i46.5075
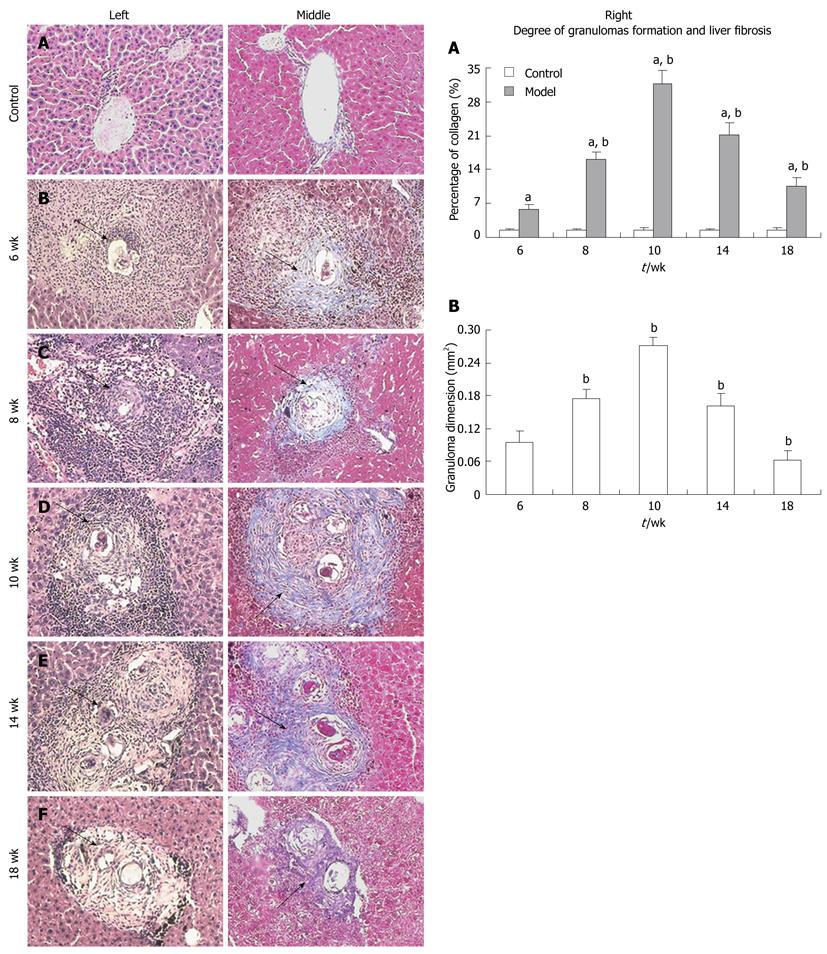
Figure 1 Representative images of hepatopathological changes over time.
HE (left) and MT (middle) staining and data showing the degree of granuloma formation and liver fibrosis (right). Arrows show granulomas. Collagen fibers are stained blue (MT staining). 100 × original magnification. HE: Hematoxylin and eosin; MT: Masson trichrome. aP < 0.05 vs control; bP < 0.05 vs previous.
-
Citation: Chen BL, Zhang GY, Yuan WJ, Wang SP, Shen YM, Yan L, Gu H, Li J. Osteopontin expression is associated with hepatopathologic changes in
Schistosoma japonicum infected mice. World J Gastroenterol 2011; 17(46): 5075-5082 - URL: https://www.wjgnet.com/1007-9327/full/v17/i46/5075.htm
- DOI: https://dx.doi.org/10.3748/wjg.v17.i46.5075


