Copyright
©2011 Baishideng Publishing Group Co.
World J Gastroenterol. Nov 21, 2011; 17(43): 4772-4778
Published online Nov 21, 2011. doi: 10.3748/wjg.v17.i43.4772
Published online Nov 21, 2011. doi: 10.3748/wjg.v17.i43.4772
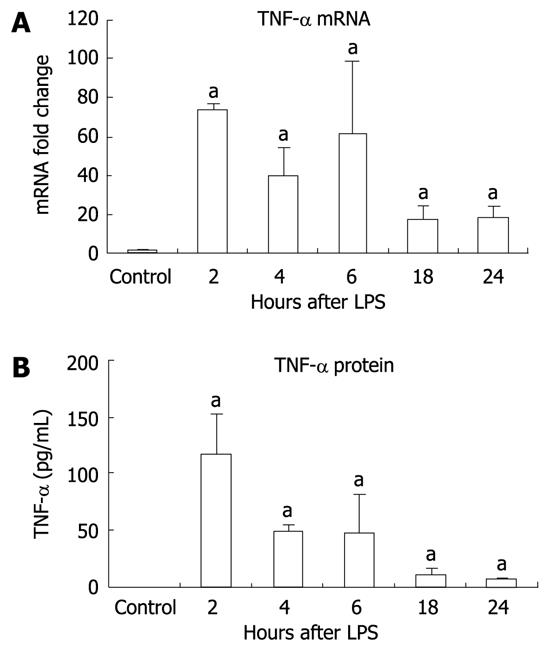
Figure 2 Inflammation in the liver is seen after lipopolysaccharide stimulation.
A: Tumor necrosis factor (TNF)-α mRNA in liver tissue was significantly increased at all time points after lipopolysaccharide (LPS) stimulation. TNF-α mRNA was analyzed by real-time quantitative polymerase chain reaction and normalized to 18S. The values are shown as a fold change to the non-stimulated LPS control; B: Similarly, TNF-α protein was significantly elevated in liver tissue following LPS stimulation as detected by enzyme-linked immunosorbent assay. Protein levels were normalized to total protein concentration in each tissue sample. Mean ± SD are shown. n = 3 for each group (except at 4 h LPS stimulation, where n = 2 due to an outlier), aP < 0.01.
- Citation: Ganz M, Csak T, Nath B, Szabo G. Lipopolysaccharide induces and activates the Nalp3 inflammasome in the liver. World J Gastroenterol 2011; 17(43): 4772-4778
- URL: https://www.wjgnet.com/1007-9327/full/v17/i43/4772.htm
- DOI: https://dx.doi.org/10.3748/wjg.v17.i43.4772


