Copyright
©2011 Baishideng Publishing Group Co.
World J Gastroenterol. Nov 7, 2011; 17(41): 4625-4631
Published online Nov 7, 2011. doi: 10.3748/wjg.v17.i41.4625
Published online Nov 7, 2011. doi: 10.3748/wjg.v17.i41.4625
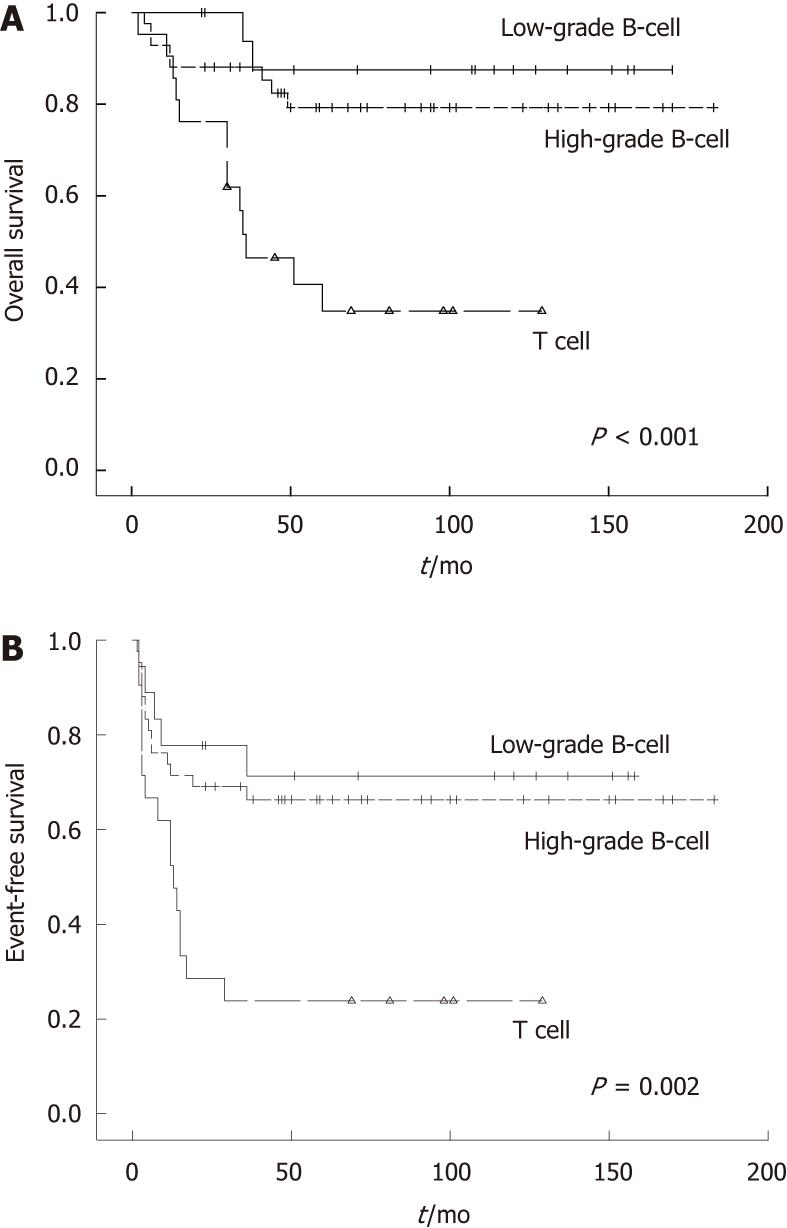
Figure 2 The survival curves stratified by the three histologic subgroups.
A: Overall survival among the three groups (P < 0.001); B: Event-free survival among the three groups (P = 0.002).
- Citation: Wang GB, Xu GL, Luo GY, Shan HB, Li Y, Gao XY, Li JJ, Zhang R. Primary intestinal non-Hodgkin's lymphoma: A clinicopathologic analysis of 81 patients. World J Gastroenterol 2011; 17(41): 4625-4631
- URL: https://www.wjgnet.com/1007-9327/full/v17/i41/4625.htm
- DOI: https://dx.doi.org/10.3748/wjg.v17.i41.4625


