Copyright
©2011 Baishideng Publishing Group Co.
World J Gastroenterol. Nov 7, 2011; 17(41): 4581-4589
Published online Nov 7, 2011. doi: 10.3748/wjg.v17.i41.4581
Published online Nov 7, 2011. doi: 10.3748/wjg.v17.i41.4581
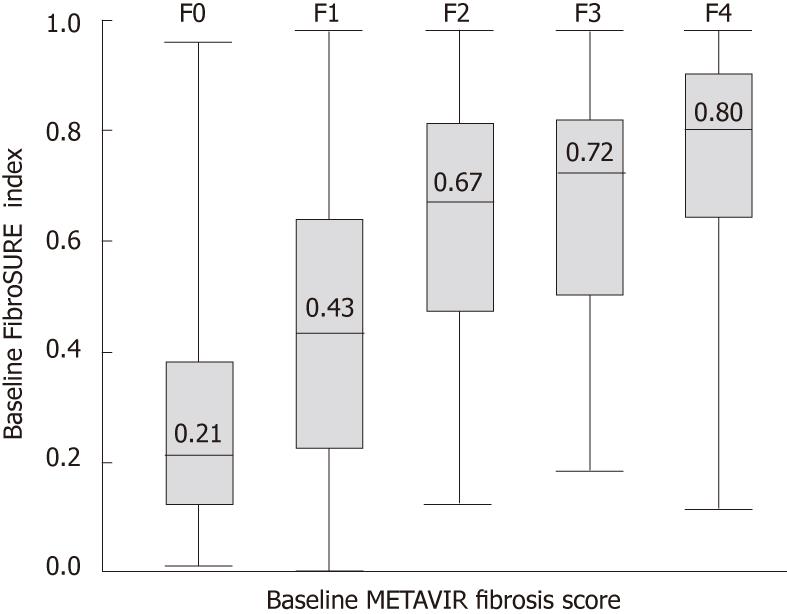
Figure 2 Boxplot distribution of FibroSURE index scores in all patients at baseline (n = 2055).
Box parameters represent 25th and 75th percentile index scores for each fibrosis stage; median index values are shown within box, and upper and lower range limits are represented by vertical lines.
- Citation: Patel K, Friedrich-Rust M, Lurie Y, Grigorescu M, Stanciu C, Lee CM, Schiff ER, Häussinger D, Manns MP, Gerken G, Colle I, Torbenson M, Pulkstenis E, Subramanian GM, McHutchison JG, Zeuzem S. FibroSURE™ and FibroScan® in relation to treatment response in chronic hepatitis C virus. World J Gastroenterol 2011; 17(41): 4581-4589
- URL: https://www.wjgnet.com/1007-9327/full/v17/i41/4581.htm
- DOI: https://dx.doi.org/10.3748/wjg.v17.i41.4581


