Copyright
©2011 Baishideng Publishing Group Co.
World J Gastroenterol. Nov 7, 2011; 17(41): 4581-4589
Published online Nov 7, 2011. doi: 10.3748/wjg.v17.i41.4581
Published online Nov 7, 2011. doi: 10.3748/wjg.v17.i41.4581
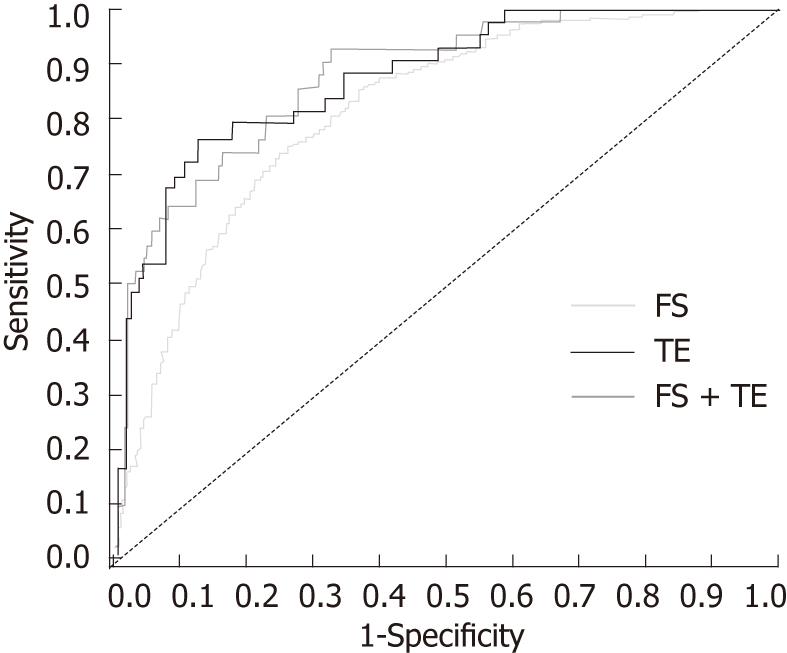
Figure 1 Baseline area-under-the-receiver-operating-curve analysis for stages F2-4 for FibroSURE and transient elastography.
Of the overall cohort with baseline biopsy (n = 2060), FibroSURE (FS) was available in 2055 patients, transient elastography (TE) in 214, and both FS and TE in 209. Area-under-the-receiver-operating-curve values for stages F2-4 were 0.82 for FS, 0.88 for TE, and 0.88 for FS + TE. Differences between FS and TE were not significant. FS: FibroSURE; TE: Transient elastography.
- Citation: Patel K, Friedrich-Rust M, Lurie Y, Grigorescu M, Stanciu C, Lee CM, Schiff ER, Häussinger D, Manns MP, Gerken G, Colle I, Torbenson M, Pulkstenis E, Subramanian GM, McHutchison JG, Zeuzem S. FibroSURE™ and FibroScan® in relation to treatment response in chronic hepatitis C virus. World J Gastroenterol 2011; 17(41): 4581-4589
- URL: https://www.wjgnet.com/1007-9327/full/v17/i41/4581.htm
- DOI: https://dx.doi.org/10.3748/wjg.v17.i41.4581


