Copyright
©2011 Baishideng Publishing Group Co.
World J Gastroenterol. Oct 28, 2011; 17(40): 4456-4460
Published online Oct 28, 2011. doi: 10.3748/wjg.v17.i40.4456
Published online Oct 28, 2011. doi: 10.3748/wjg.v17.i40.4456
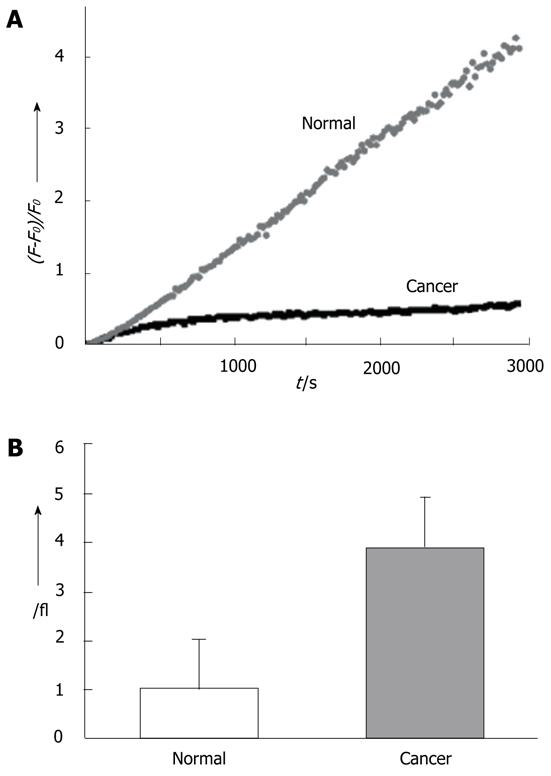
Figure 3 AG2 uptake in normal and cancerous tissues.
A: Time course of AG2 uptake by normal tissue and cancer tissue at 100 μm depth as a function of time; B: Relative AG2 uptake by normal tissue and cancer tissue for 4000 s. The columns indicate the sum of the two-photon excited fluorescence intensities measured by photomultiplier tube at depths of 75, 100, 125 and 150 μm from the tissue surface, relative to that of normal tissue. The data are the average of three independent experiments.
- Citation: Cho HJ, Chun HJ, Kim ES, Cho BR. Multiphoton microscopy: An introduction to gastroenterologists. World J Gastroenterol 2011; 17(40): 4456-4460
- URL: https://www.wjgnet.com/1007-9327/full/v17/i40/4456.htm
- DOI: https://dx.doi.org/10.3748/wjg.v17.i40.4456


