Copyright
©2011 Baishideng Publishing Group Co.
World J Gastroenterol. Sep 21, 2011; 17(35): 3976-3985
Published online Sep 21, 2011. doi: 10.3748/wjg.v17.i35.3976
Published online Sep 21, 2011. doi: 10.3748/wjg.v17.i35.3976
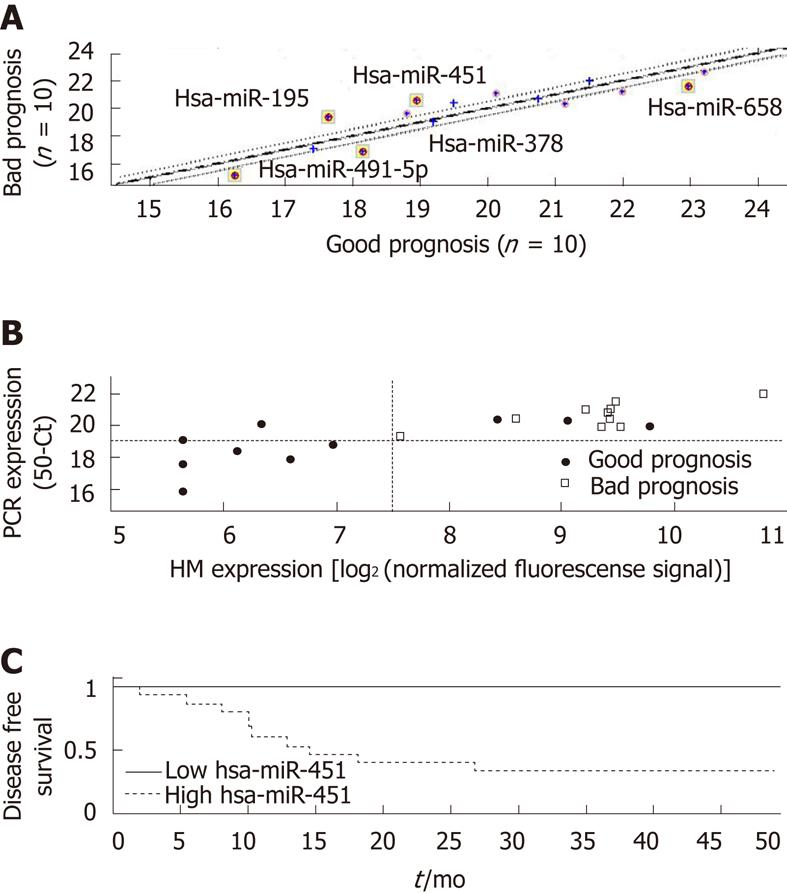
Figure 5 Validation by quantitative real-time polymerase chain reaction A: Differential expression of microRNAs (miRs) between a subset of the gastric cancer samples from patients with good prognosis (n = 10) or bad prognosis (n = 10).
Median expression data are shown for all probes tested. Cycle threshold (CT) values are the inverses of the log signals; therefore, median values are given in 50-CT (50CT) to maintain the same sense as the array data; B: Correlation of expression signals of miR-451 between microarrays (log2 normalized fluorescence units) and quantitative real-time polymerase chain reaction (qRT-PCR) (50CT). Good-prognosis cases are represented by filled circles, bad-prognosis cases by empty squares. Dotted lines indicate the thresholds of the miR-451 signal at normalized fluorescence of 181 units [log2(181) = 7.5] and at 50CT = 19. The correlation coefficient (Pearson) between the signals is 0.83; C: Recurrence in 20 cases, measured by qRT-PCR, grouped by 50CT < 19 (solid line, n = 5) or 50CT > 19 (dotted line, n = 15). P = 0.015 by log-rank test. MiR: MicroRNA; PCR: Polymerase chain reaction; HM: Human custom microRNA-Microarray.
- Citation: Brenner B, Hoshen MB, Purim O, David MB, Ashkenazi K, Marshak G, Kundel Y, Brenner R, Morgenstern S, Halpern M, Rosenfeld N, Chajut A, Niv Y, Kushnir M. MicroRNAs as a potential prognostic factor in gastric cancer. World J Gastroenterol 2011; 17(35): 3976-3985
- URL: https://www.wjgnet.com/1007-9327/full/v17/i35/3976.htm
- DOI: https://dx.doi.org/10.3748/wjg.v17.i35.3976


