Copyright
©2011 Baishideng Publishing Group Co.
World J Gastroenterol. Aug 21, 2011; 17(31): 3605-3613
Published online Aug 21, 2011. doi: 10.3748/wjg.v17.i31.3605
Published online Aug 21, 2011. doi: 10.3748/wjg.v17.i31.3605
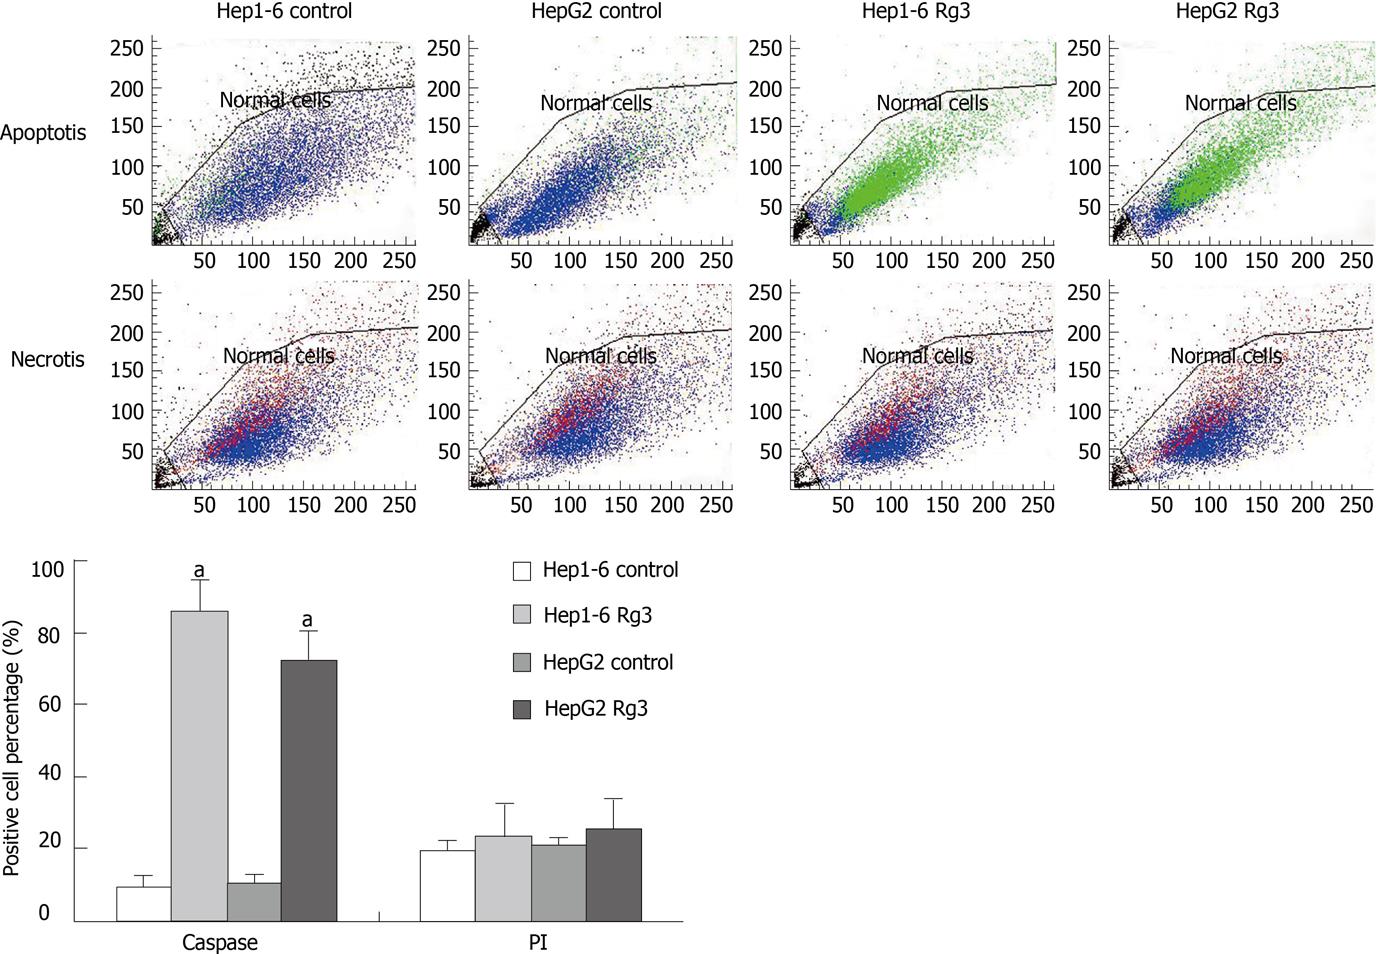
Figure 6 Flow cytometry after caspase-3-fluorescein isothiocyanate/propidium Iodide staining.
After being treated by ginsenoside Rg3 (Rg3) 100 μg/mL or saline for 24 h, Hep1-6 and HepG2 cells were stained by caspase-3-fluorescein isothiocyanate (FITC) and propidium Iodide (PI). Viable cells are shown as blue and early apoptotic cells are green (caspase-3-FITC). The non-viable necrotic cells are red (PI). Rg3 treated groups had a significantly higher percentage of caspase-3 positive cells: Hep1-6 (85% ± 9% vs 9% ± 3%) and HepG2 (71% ± 8% vs 11% ± 2%). There are no statistical difference in PI staining between Rg3 treated group and control group: Hep1-6 (23% ± 3% vs 19% ± 2%) and HepG2 (25% ± 4% vs 21% ± 3%). Rg3: Ginsenoside Rg3. aP < 0.05 vs control group.
-
Citation: Jiang JW, Chen XM, Chen XH, Zheng SS. Ginsenoside Rg3 inhibit hepatocellular carcinoma growth
via intrinsic apoptotic pathway. World J Gastroenterol 2011; 17(31): 3605-3613 - URL: https://www.wjgnet.com/1007-9327/full/v17/i31/3605.htm
- DOI: https://dx.doi.org/10.3748/wjg.v17.i31.3605


