Copyright
©2011 Baishideng Publishing Group Co.
World J Gastroenterol. Jul 28, 2011; 17(28): 3335-3341
Published online Jul 28, 2011. doi: 10.3748/wjg.v17.i28.3335
Published online Jul 28, 2011. doi: 10.3748/wjg.v17.i28.3335
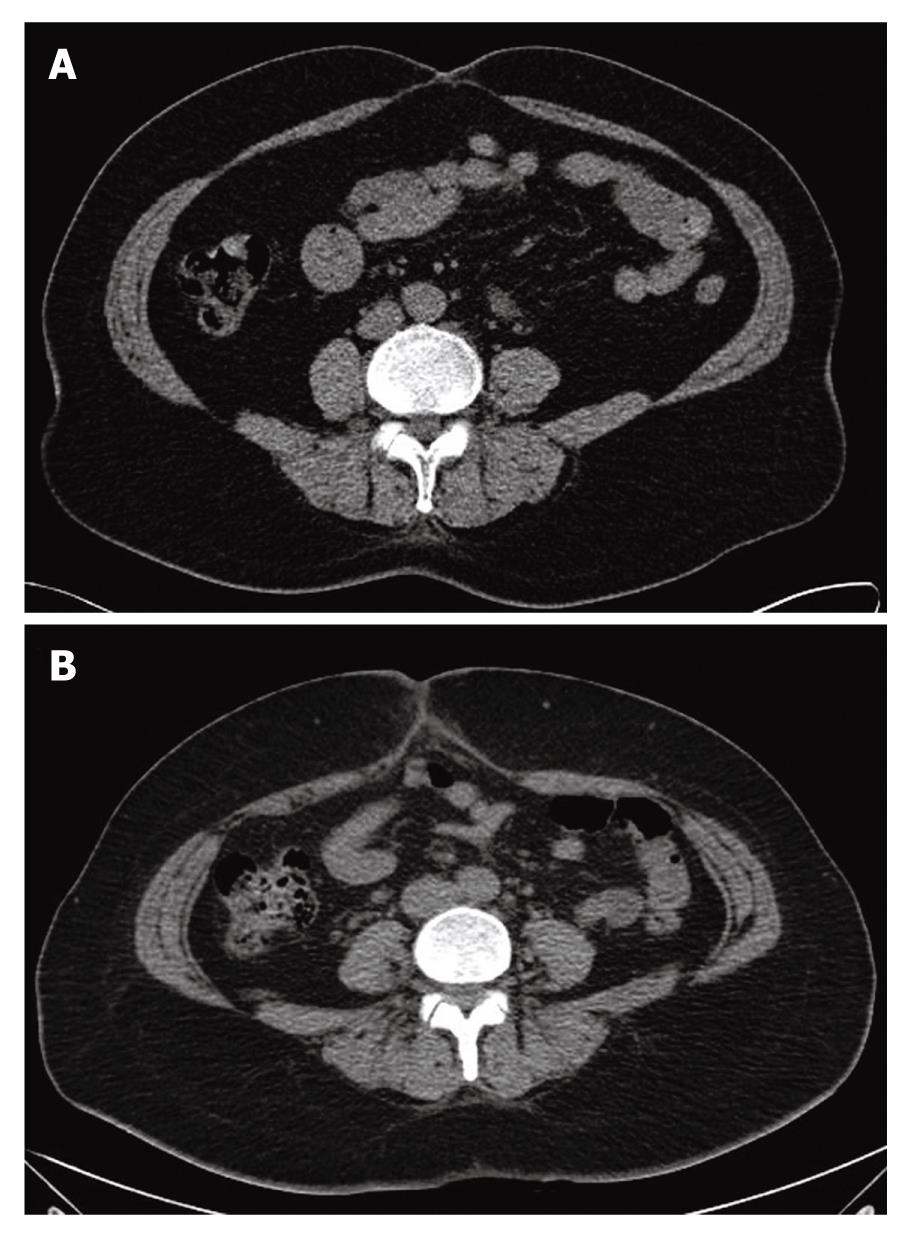
Figure 4 Computed tomography showing cross-sectional abdominal areas at the level of umbilicus in two patients demonstrating variation in fat distribution.
A: Visceral type [49-year-old female; body mass index (BMI), 23.1 kg/m2; visceral fat (VF) area, 146 cm2; subcutaneous fat (SF) area, 115 cm2; the ratio of VF to SF (VS ratio), 1.27]; B: Subcutaneous type (40-year-old female; BMI, 24.0 kg/m2; VF area, 60 cm2; SF area, 190 cm2; VS ratio, 0.31).
- Citation: Jang S, Lee CH, Choi KM, Lee J, Choi JW, Kim KA, Park CM. Correlation of fatty liver and abdominal fat distribution using a simple fat computed tomography protocol. World J Gastroenterol 2011; 17(28): 3335-3341
- URL: https://www.wjgnet.com/1007-9327/full/v17/i28/3335.htm
- DOI: https://dx.doi.org/10.3748/wjg.v17.i28.3335


