Copyright
©2011 Baishideng Publishing Group Co.
World J Gastroenterol. Jul 28, 2011; 17(28): 3335-3341
Published online Jul 28, 2011. doi: 10.3748/wjg.v17.i28.3335
Published online Jul 28, 2011. doi: 10.3748/wjg.v17.i28.3335
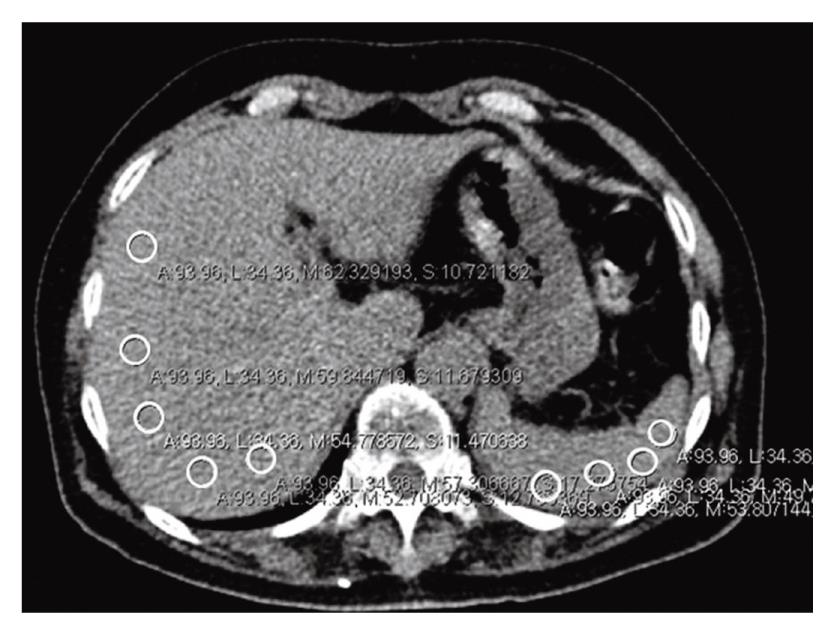
Figure 2 Measurement of attenuation value of the liver and the spleen.
Five regions of interests (ROIs) were placed in the liver avoiding vessels, bile ducts, calcifications, and artifacts. In the spleen, four ROIs were placed in the same manner.
- Citation: Jang S, Lee CH, Choi KM, Lee J, Choi JW, Kim KA, Park CM. Correlation of fatty liver and abdominal fat distribution using a simple fat computed tomography protocol. World J Gastroenterol 2011; 17(28): 3335-3341
- URL: https://www.wjgnet.com/1007-9327/full/v17/i28/3335.htm
- DOI: https://dx.doi.org/10.3748/wjg.v17.i28.3335


