Copyright
©2011 Baishideng Publishing Group Co.
World J Gastroenterol. Jun 28, 2011; 17(24): 2909-2923
Published online Jun 28, 2011. doi: 10.3748/wjg.v17.i24.2909
Published online Jun 28, 2011. doi: 10.3748/wjg.v17.i24.2909
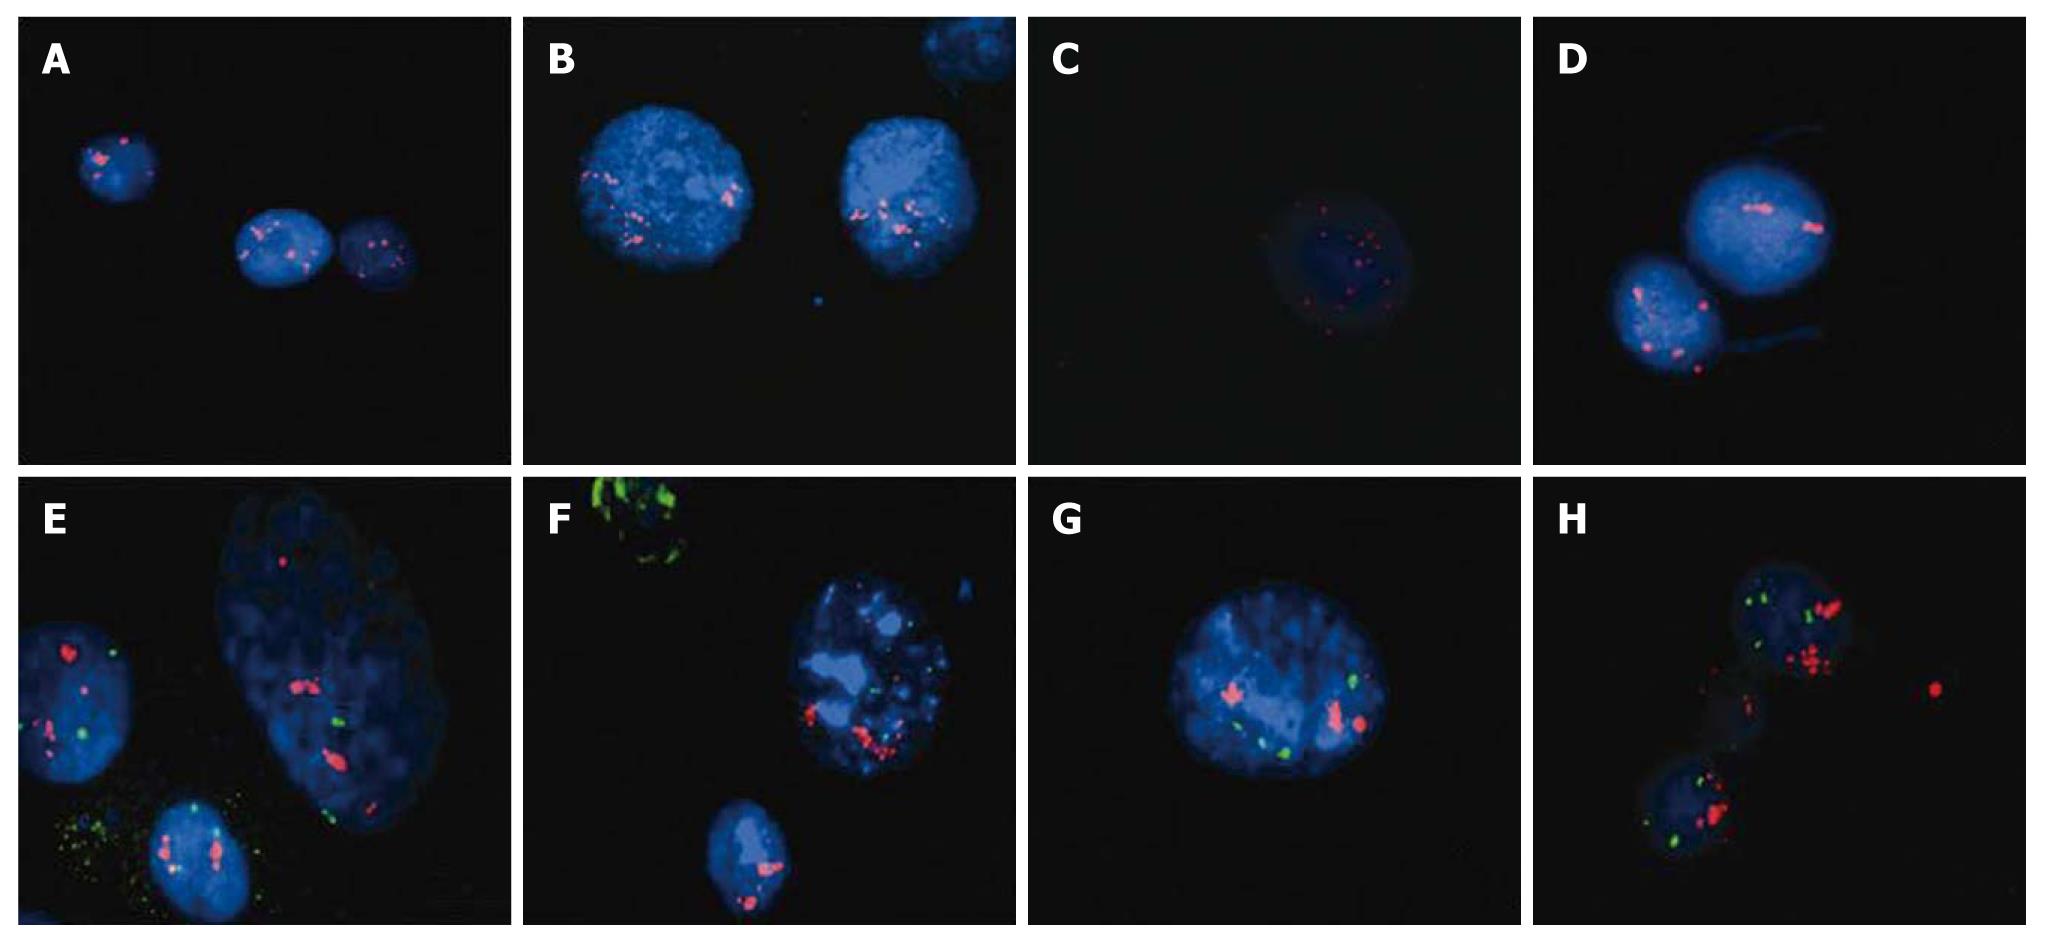
Figure 8 DAPI stained interphase nuclei hybridized with locus specific probes for C-MYC Spectrum Orange (red) (A-D) and CCND1 (red)/IGH (green) (E-H).
C-MYC amplification can be seen in cell lines WHCO1 (A), WHCO3 (B), WHCO5 (C) and SNO (D). CCND1 amplification was detected in cell lines WHCO3 (E), WHCO5 (F), WHCO6 (G) and SNO (H).
- Citation: Brown J, Bothma H, Veale R, Willem P. Genomic imbalances in esophageal carcinoma cell lines involve Wnt pathway genes. World J Gastroenterol 2011; 17(24): 2909-2923
- URL: https://www.wjgnet.com/1007-9327/full/v17/i24/2909.htm
- DOI: https://dx.doi.org/10.3748/wjg.v17.i24.2909


