Copyright
©2011 Baishideng Publishing Group Co.
World J Gastroenterol. Jun 28, 2011; 17(24): 2909-2923
Published online Jun 28, 2011. doi: 10.3748/wjg.v17.i24.2909
Published online Jun 28, 2011. doi: 10.3748/wjg.v17.i24.2909
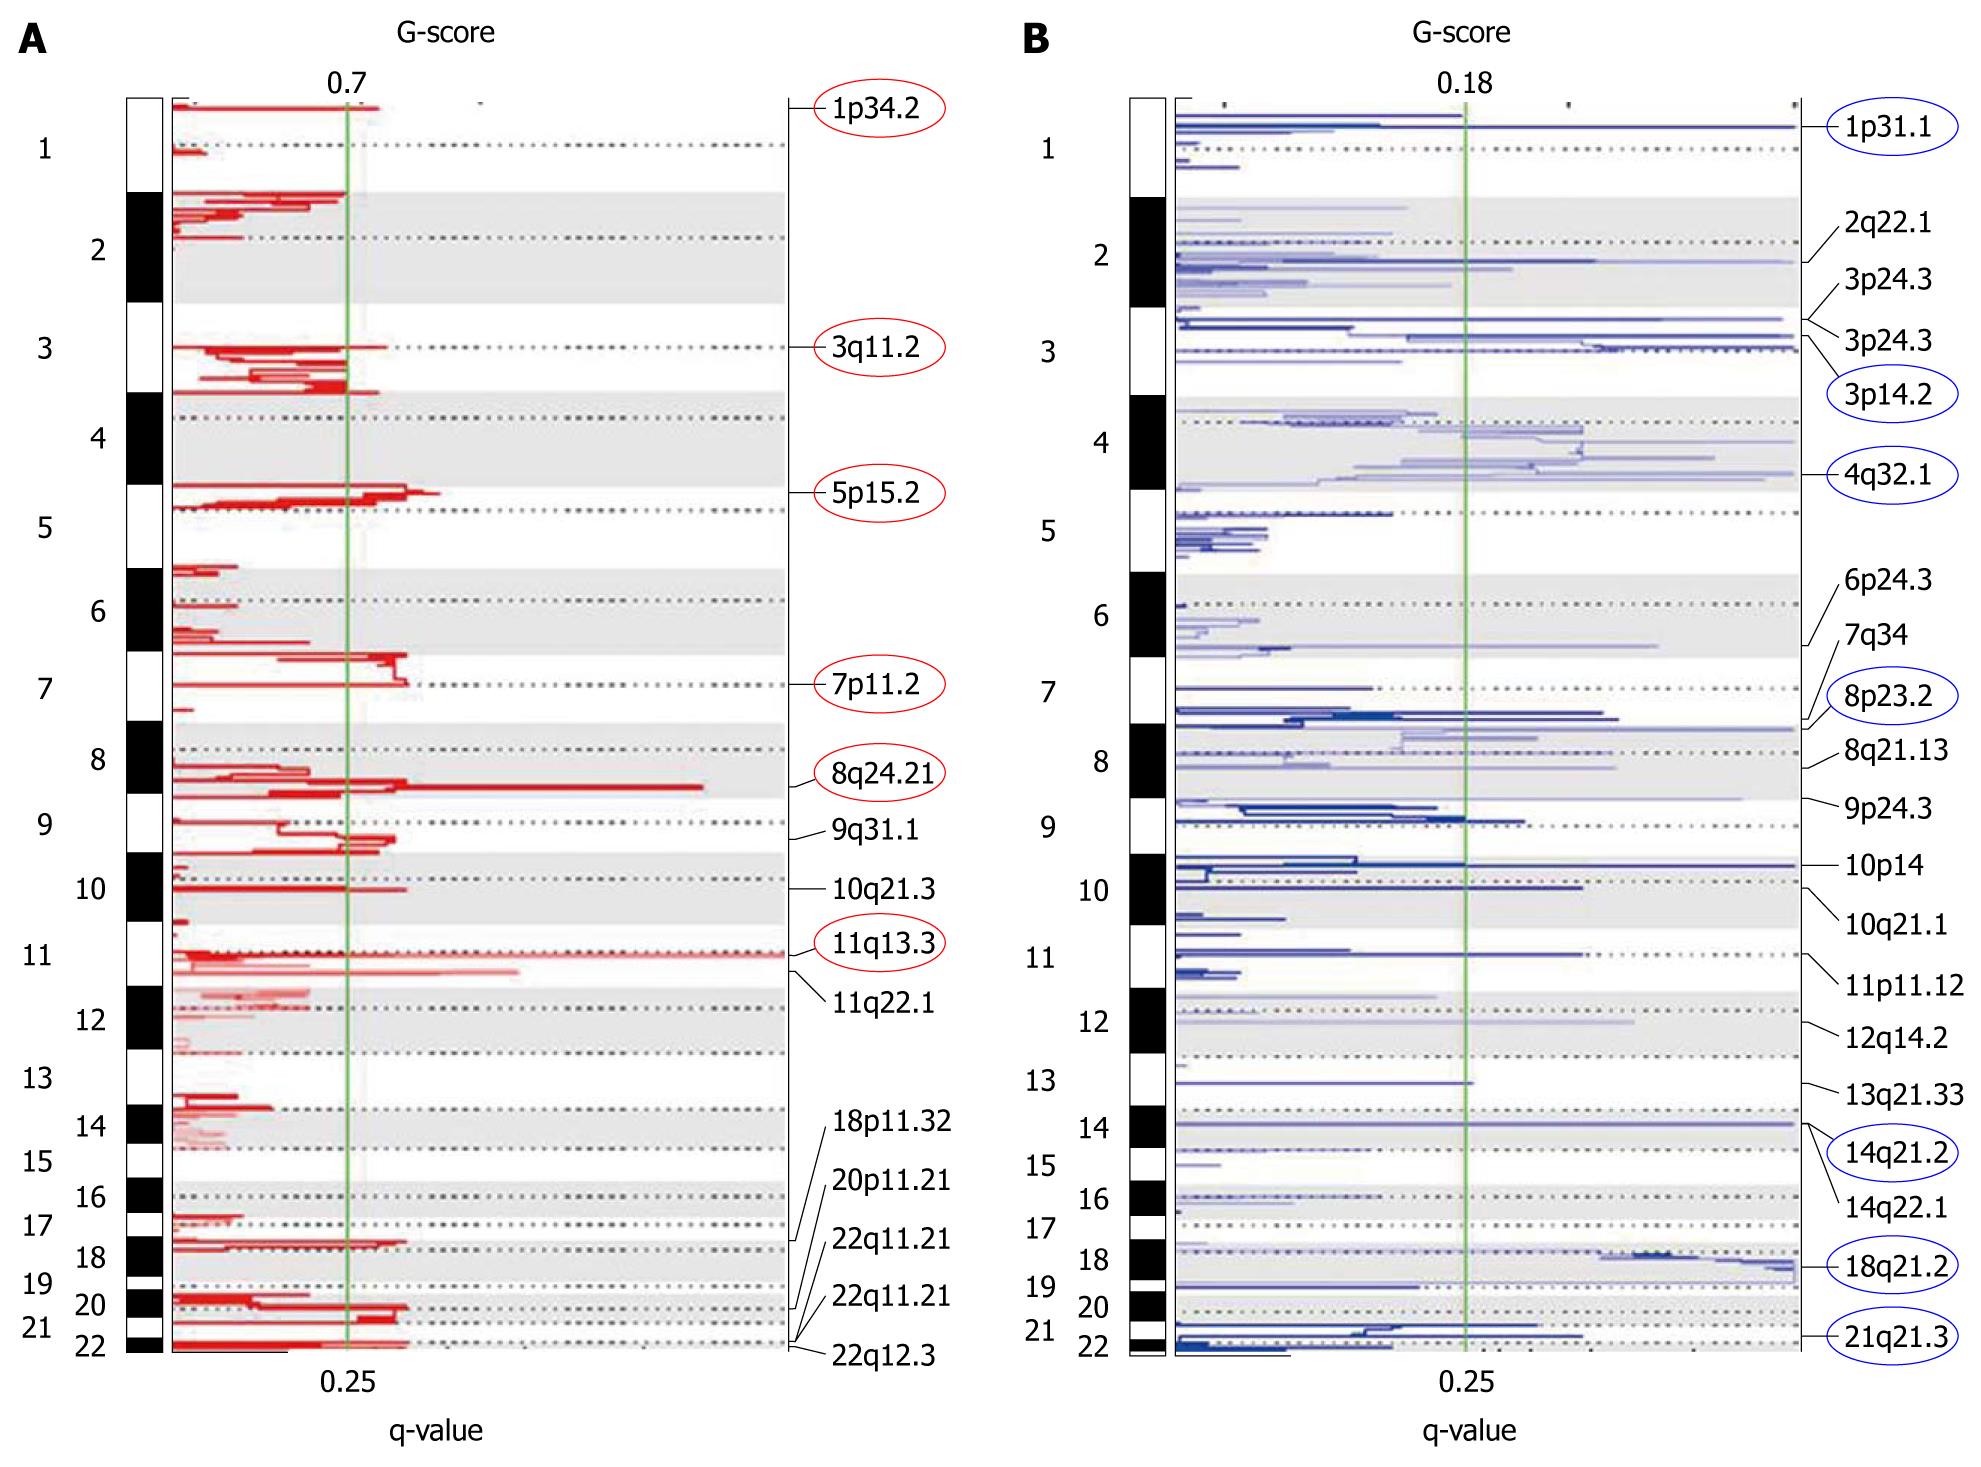
Figure 7 Plots of recurrent genomic amplifications (A) and deletions (B) detected in the esophageal squamous cell carcinoma cell lines from GISTIC analysis of single nucleotide polymorphism array data.
The x-axis shows the G-score (top) and false discovery rate (q value; bottom). The green line indicates the false discovery rate cut off of 0.25. The circles indicate the peaks of the most significantly aberrant chromosomal regions.
- Citation: Brown J, Bothma H, Veale R, Willem P. Genomic imbalances in esophageal carcinoma cell lines involve Wnt pathway genes. World J Gastroenterol 2011; 17(24): 2909-2923
- URL: https://www.wjgnet.com/1007-9327/full/v17/i24/2909.htm
- DOI: https://dx.doi.org/10.3748/wjg.v17.i24.2909


