Copyright
©2011 Baishideng Publishing Group Co.
World J Gastroenterol. Jun 28, 2011; 17(24): 2909-2923
Published online Jun 28, 2011. doi: 10.3748/wjg.v17.i24.2909
Published online Jun 28, 2011. doi: 10.3748/wjg.v17.i24.2909
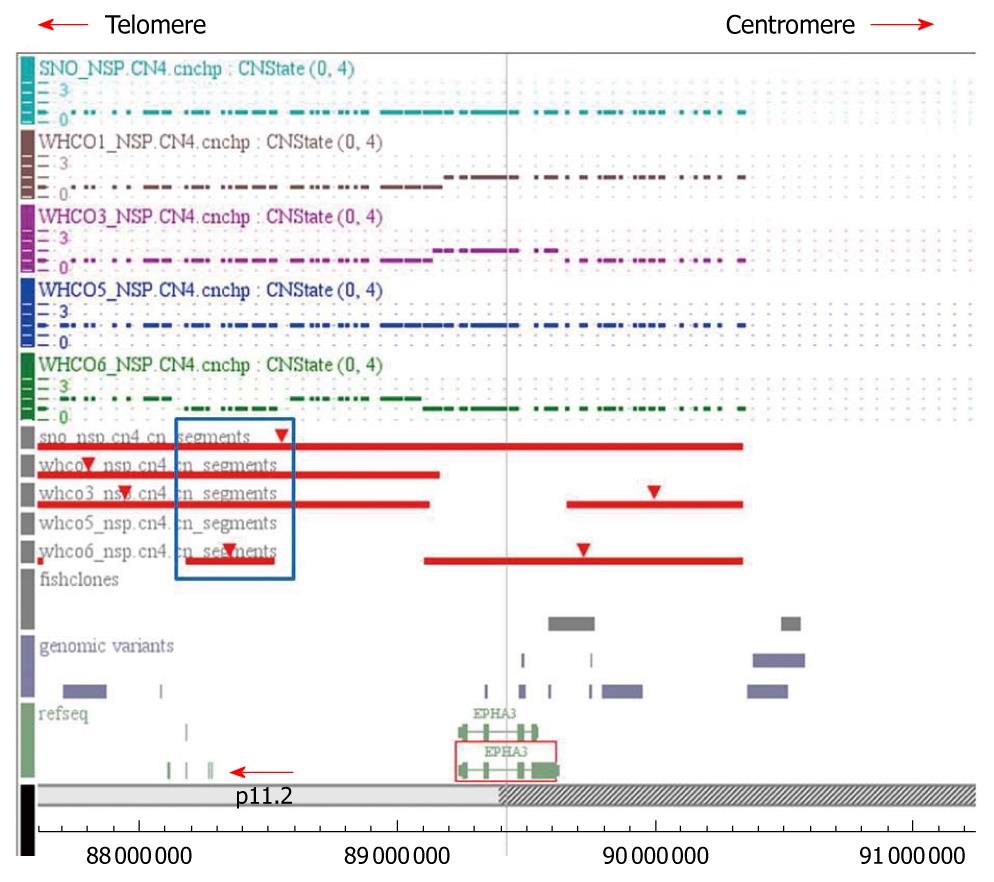
Figure 5 CNAT plot of single nucleotide polymorphism hybridization results showing the map of the region of deletion on chromosome 3p11.
2-12.1 in cell lines WHCO1, WHCO3, WHCO5, WHCO6 and SNO. The red bars indicate the segment of deletion as determined by CNAT 4.0. The dotted lines indicate the copy number status for each single nucleotide polymorphism probe for each cell line. The blue block indicates the minimal common region of deletion and the red arrow indicates the two genes in this region, c3orf38 and CGGBP1.
- Citation: Brown J, Bothma H, Veale R, Willem P. Genomic imbalances in esophageal carcinoma cell lines involve Wnt pathway genes. World J Gastroenterol 2011; 17(24): 2909-2923
- URL: https://www.wjgnet.com/1007-9327/full/v17/i24/2909.htm
- DOI: https://dx.doi.org/10.3748/wjg.v17.i24.2909


