Copyright
©2011 Baishideng Publishing Group Co.
World J Gastroenterol. Jan 14, 2011; 17(2): 242-248
Published online Jan 14, 2011. doi: 10.3748/wjg.v17.i2.242
Published online Jan 14, 2011. doi: 10.3748/wjg.v17.i2.242
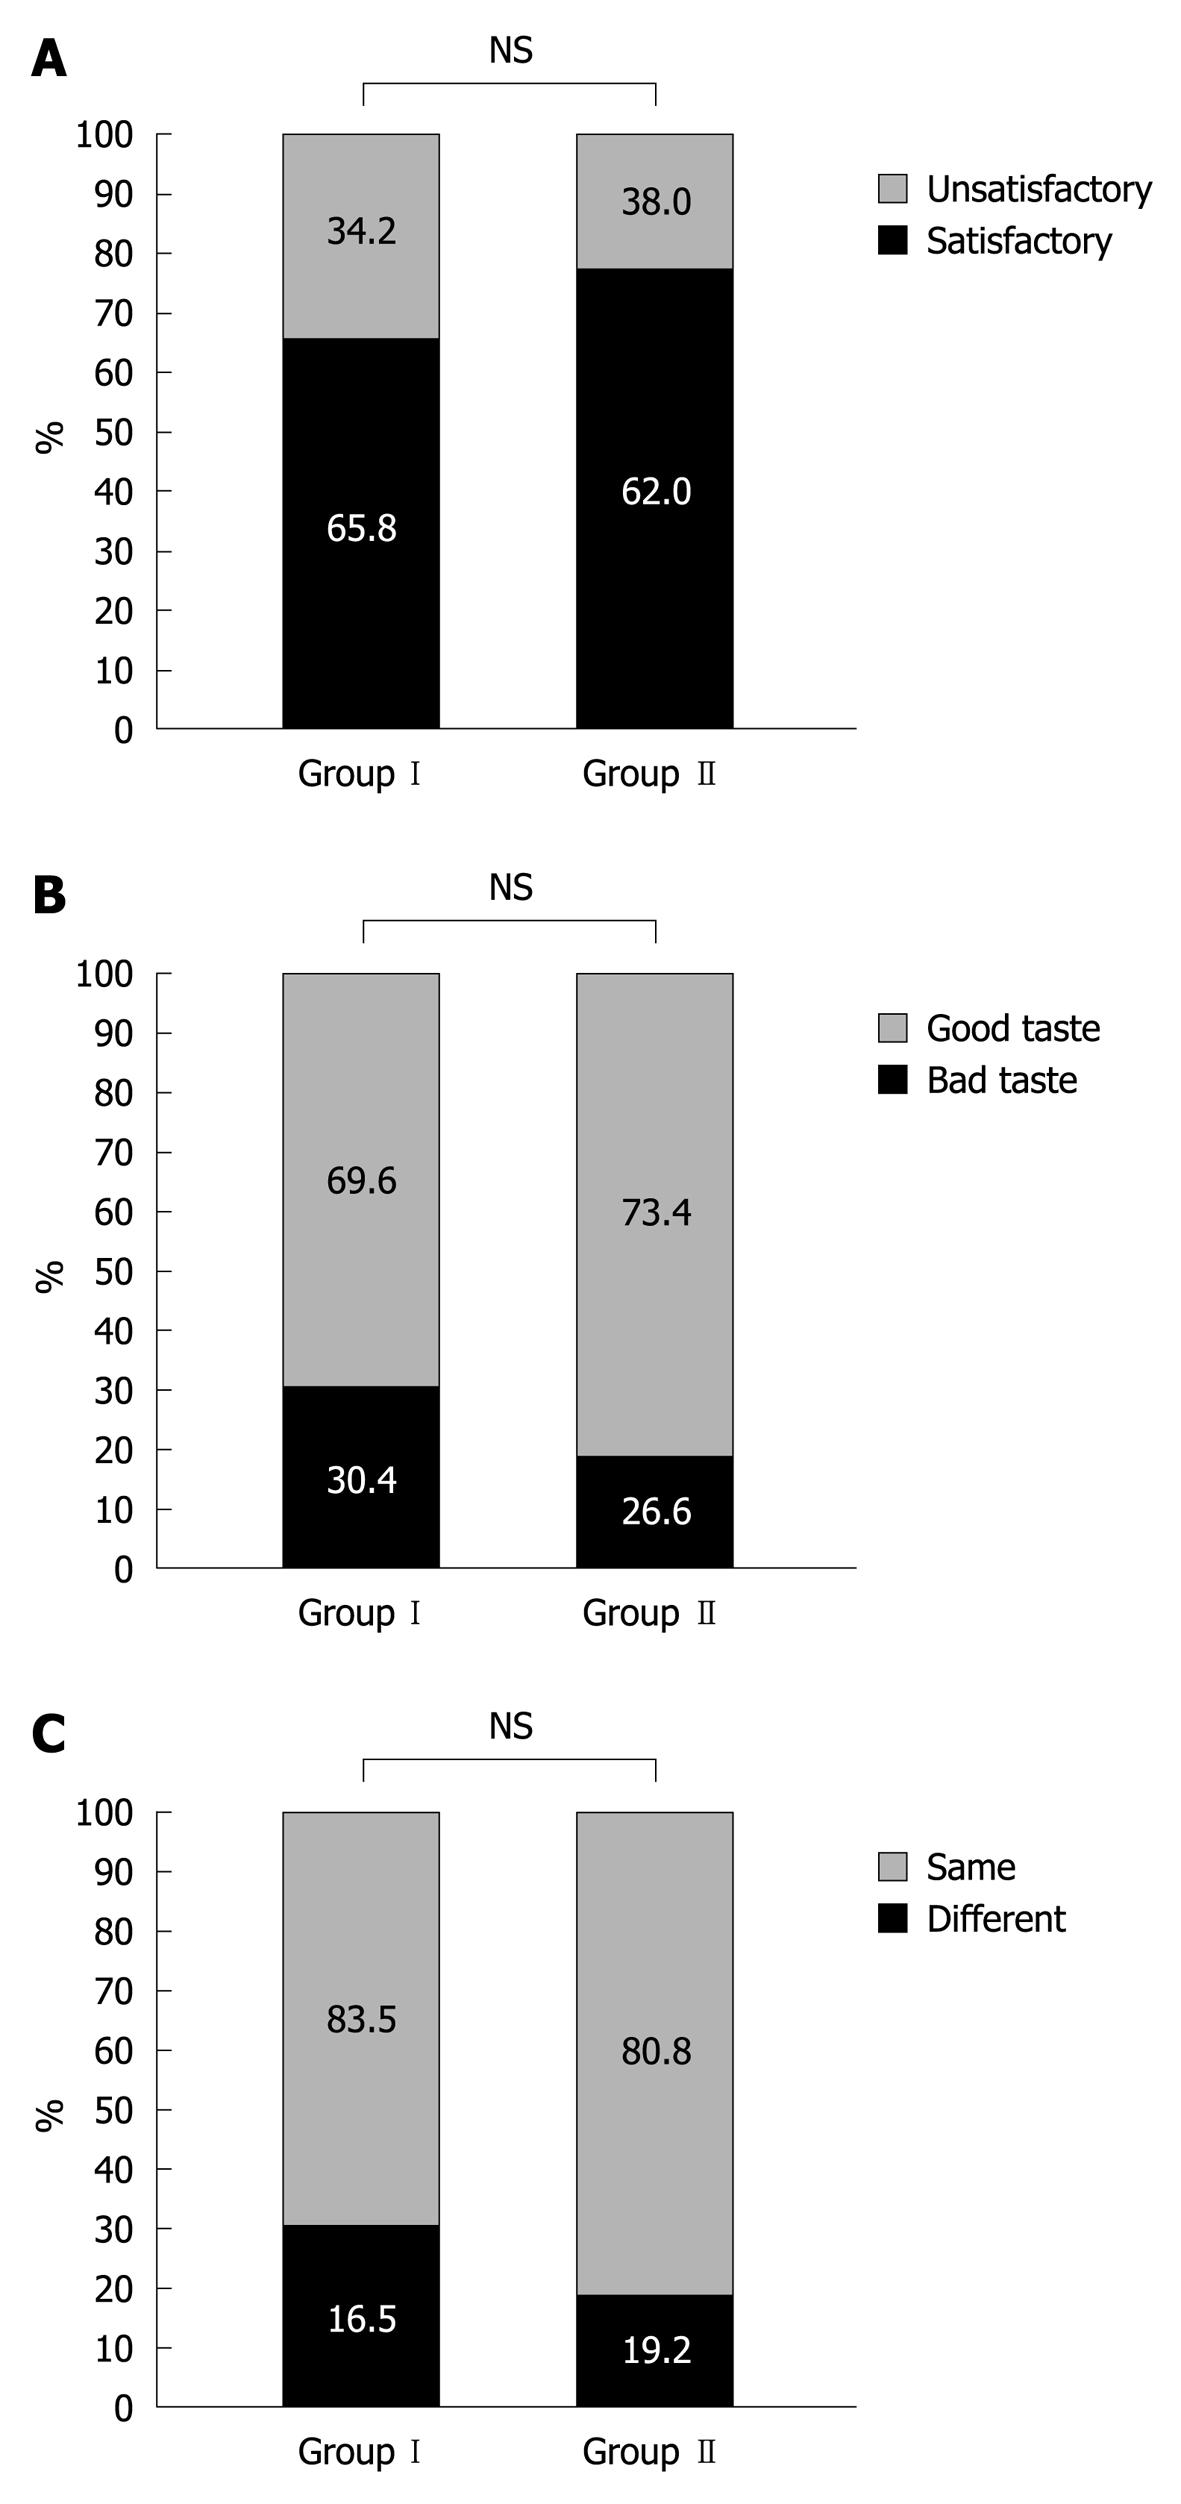
Figure 2 Patient acceptability.
A: For overall satisfaction, 65.8% in Group I and 82.0% in Group II replied that they were “satisfied” or it was “fair”; B: For assessing taste, the percentage of patients who responded “good or tolerable” was not significantly different between Group I (69.6%) and Group II (73.4%); C: For the willingness to repeat the regimen, the percentage of patients who responded “yes” was not significantly different between Group I (83.5%) and Group II (80.8%). NS: Not significant.
- Citation: Choi YS, Suh JP, Kim JK, Lee IT, Youk EG, Lee DS, Kim DS, Lee DH. Magnesium citrate with a single dose of sodium phosphate for colonoscopy bowel preparation. World J Gastroenterol 2011; 17(2): 242-248
- URL: https://www.wjgnet.com/1007-9327/full/v17/i2/242.htm
- DOI: https://dx.doi.org/10.3748/wjg.v17.i2.242


