Copyright
©2011 Baishideng Publishing Group Co.
World J Gastroenterol. Jan 14, 2011; 17(2): 151-163
Published online Jan 14, 2011. doi: 10.3748/wjg.v17.i2.151
Published online Jan 14, 2011. doi: 10.3748/wjg.v17.i2.151
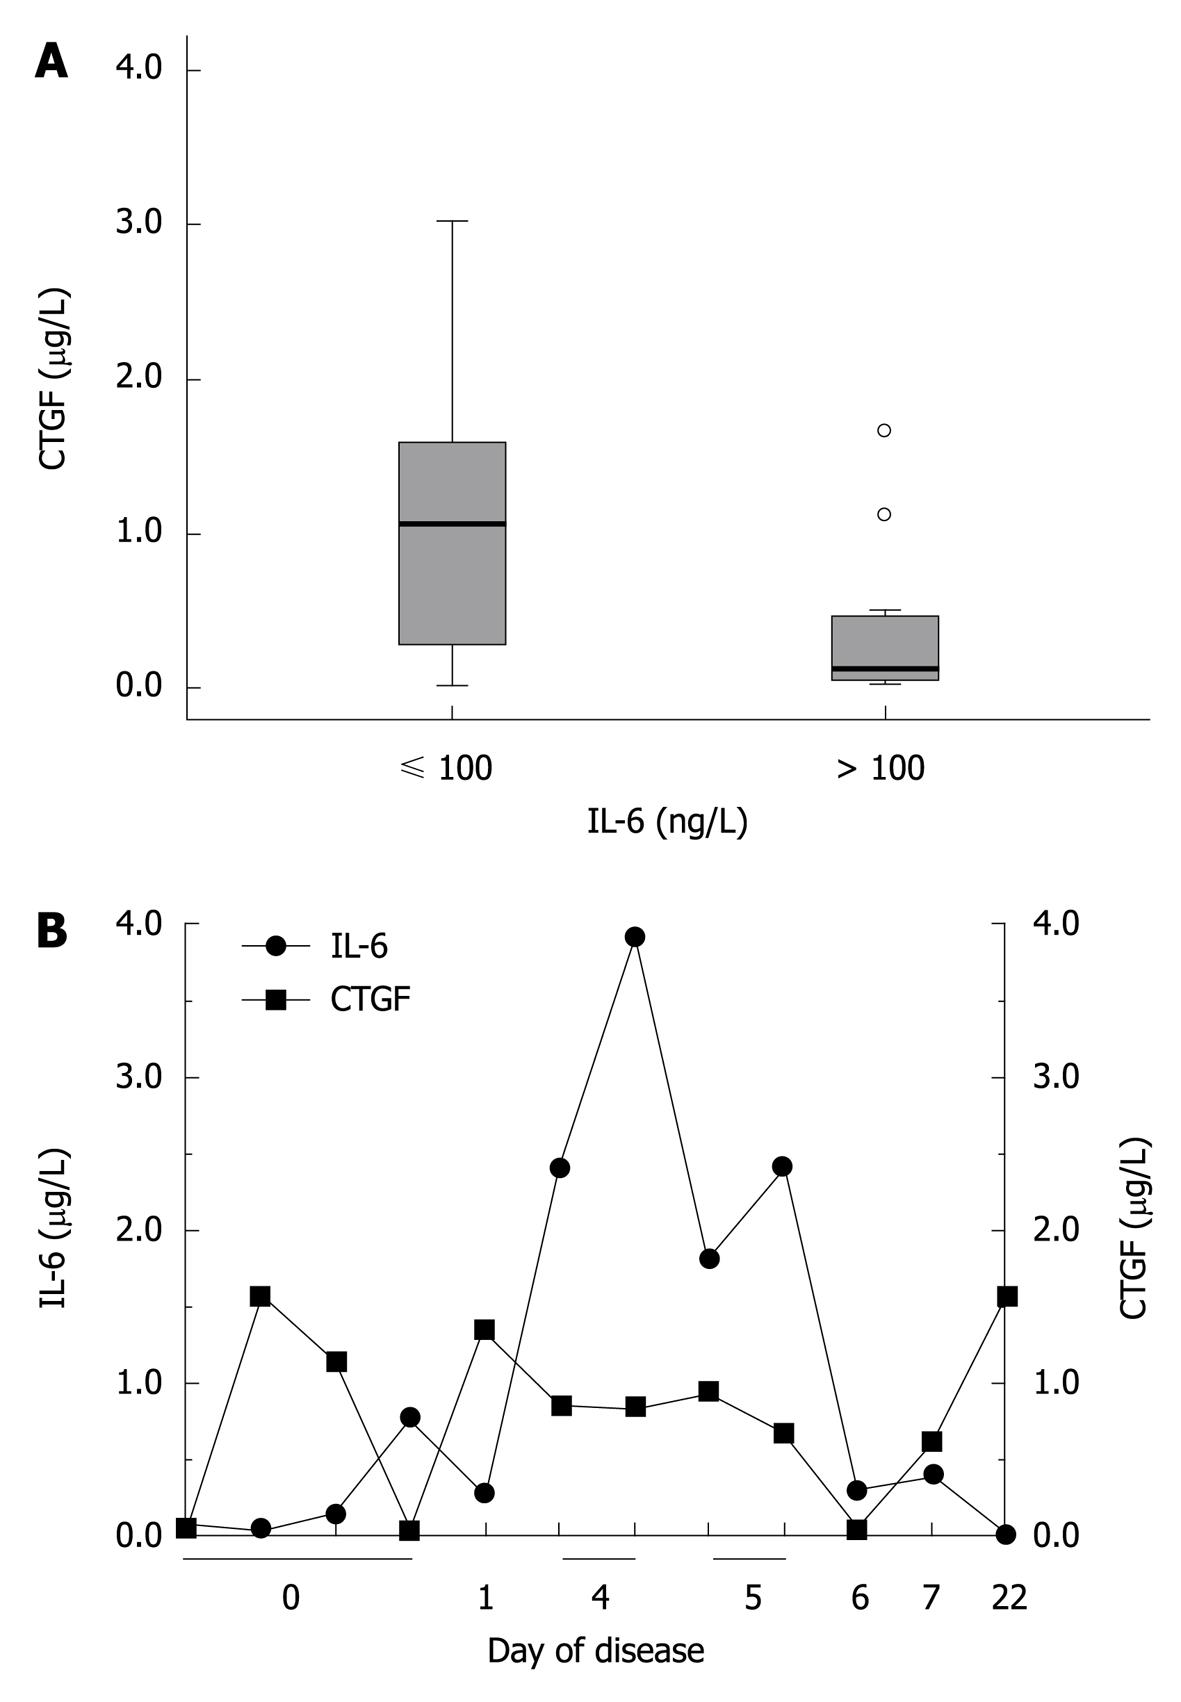
Figure 5 Inverse relation of interleukin-6 and CYR61/CTGF/NOV 2/connective tissue growth factor serum concentrations in patients with different severity of an acute phase reaction.
A: Patients (n = 36) were categorized according to their interleukin (IL)-6 serum concentrations. Corresponding CYR61/CTGF/NOV (CCN) 2/connective tissue growth factor (CTGF) concentrations were significantly lower in patients with high IL-6 serum concentrations (IL-6 > 100 ng/L, n = 15) compared to those with low IL-6 serum concentrations (IL-6 ≤ 100 ng/L, n = 21). Box plot are displayed, where the dotted line indicates the median per group, the box represents 50% of the values, and horizontal lines show minimum and maximum values of the calculated non-outlier values; open circles indicate outlier values; B: Longitudinal development of CCN2/CTGF and IL-6 serum concentrations in one representative individual patient (20 years old, male) over a time period of 22 d.
- Citation: Gressner OA, Peredniene I, Gressner AM. Connective tissue growth factor reacts as an IL-6/STAT3-regulated hepatic negative acute phase protein. World J Gastroenterol 2011; 17(2): 151-163
- URL: https://www.wjgnet.com/1007-9327/full/v17/i2/151.htm
- DOI: https://dx.doi.org/10.3748/wjg.v17.i2.151


