Copyright
©2011 Baishideng Publishing Group Co.
World J Gastroenterol. May 7, 2011; 17(17): 2229-2235
Published online May 7, 2011. doi: 10.3748/wjg.v17.i17.2229
Published online May 7, 2011. doi: 10.3748/wjg.v17.i17.2229
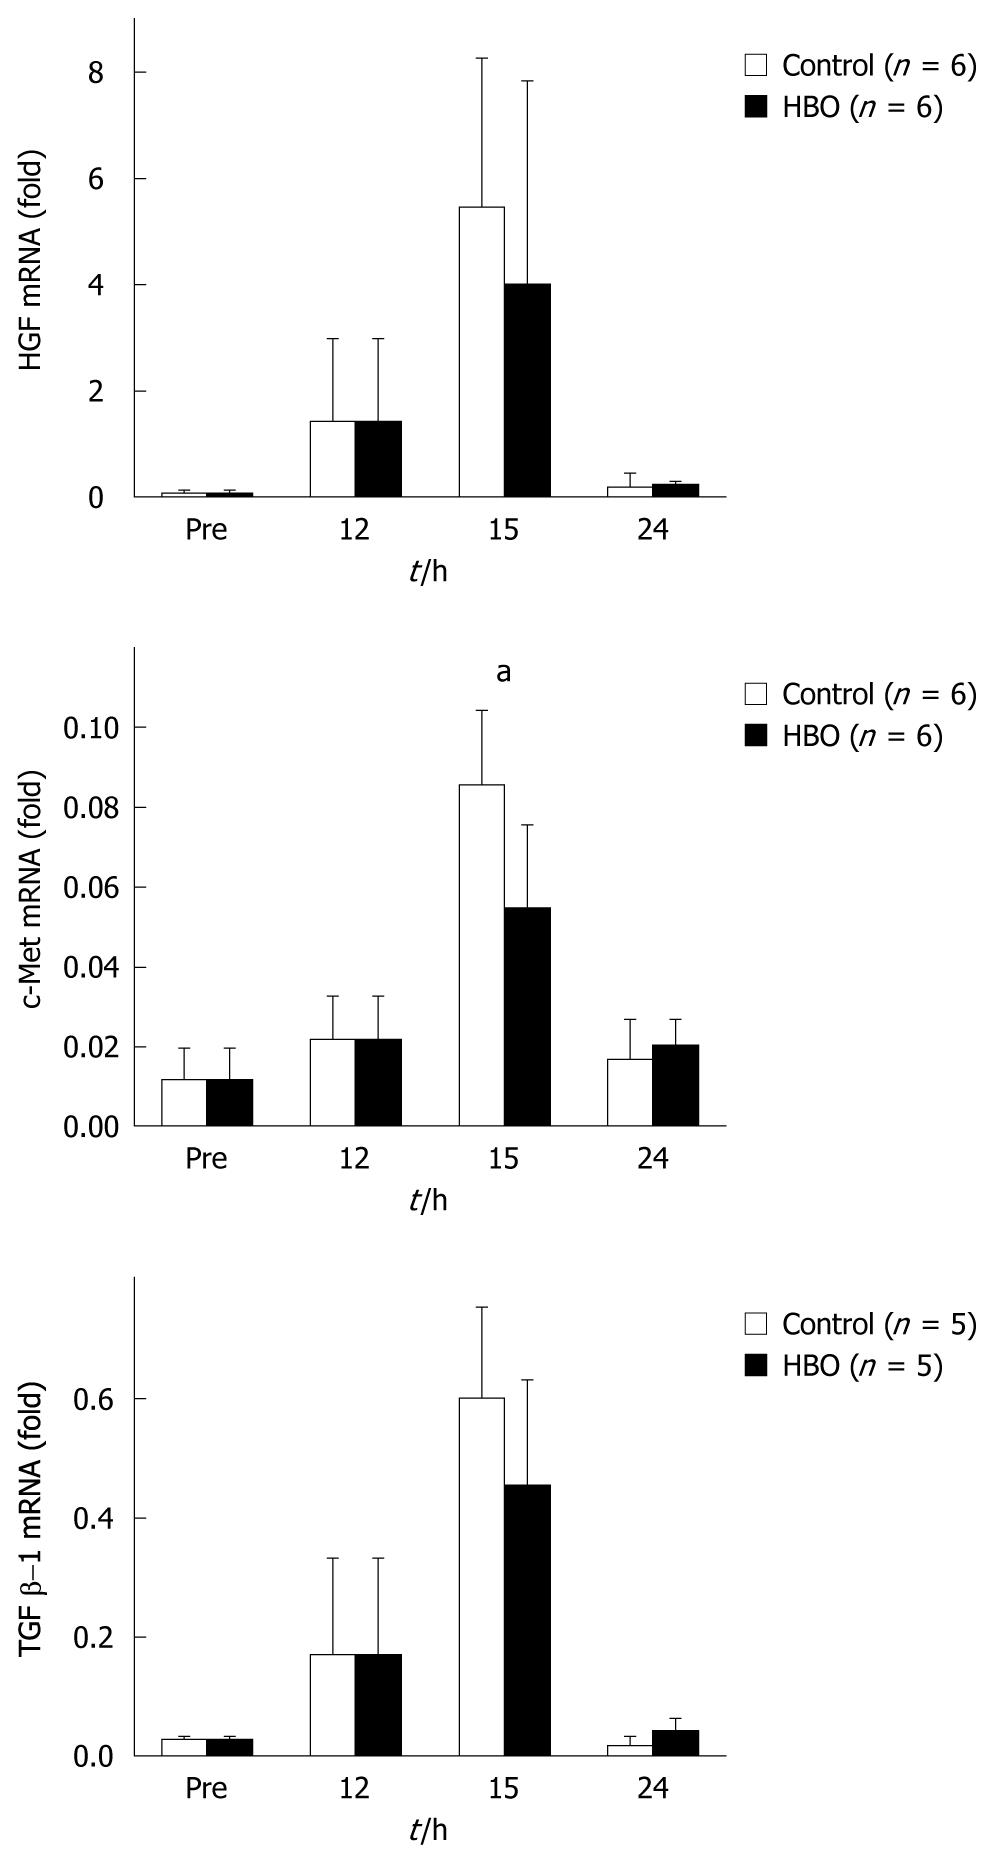
Figure 6 Expressions of hepatocyte growth factor, c-Met and transforming growth factor β-1 mRNA in the liver tissues determined at various time points.
Results are expressed as mean ± SD. Hepatocyte growth factor (HGF) and c-Met: n = 6 for each period in each group, transforming growth factor (TGF) β-1: n = 5 for each period in each group. aP < 0.05.
- Citation: Idetsu A, Suehiro T, Okada K, Shimura T, Kuwano H. Hyperbaric oxygenation promotes regeneration of biliary cells and improves cholestasis in rats. World J Gastroenterol 2011; 17(17): 2229-2235
- URL: https://www.wjgnet.com/1007-9327/full/v17/i17/2229.htm
- DOI: https://dx.doi.org/10.3748/wjg.v17.i17.2229


