Copyright
©2011 Baishideng Publishing Group Co.
World J Gastroenterol. May 7, 2011; 17(17): 2229-2235
Published online May 7, 2011. doi: 10.3748/wjg.v17.i17.2229
Published online May 7, 2011. doi: 10.3748/wjg.v17.i17.2229
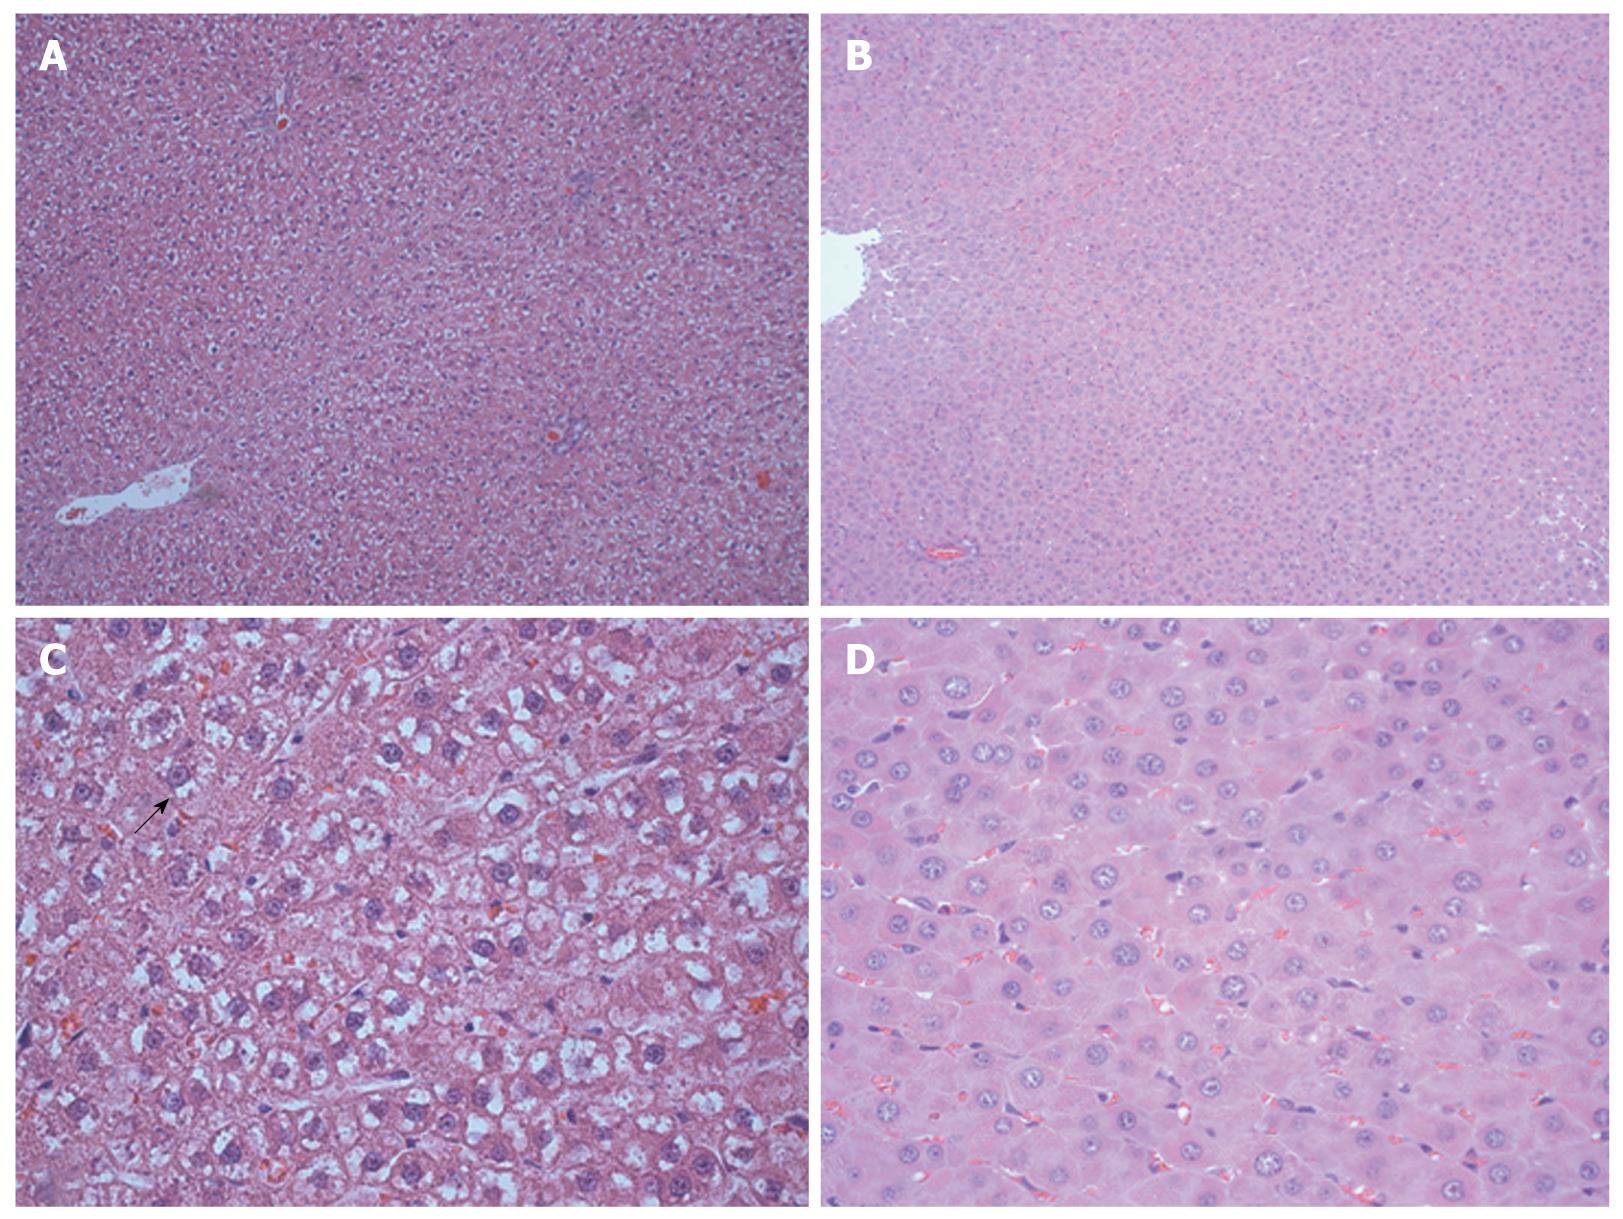
Figure 4 Hematoxylin and eosin staining of the liver slices at 96 h after hepatectomy.
Control group (A: 100 × magnification, C: 400 ×). Hyperbaric oxygenation (HBO) group (B: 100 ×, D: 400 ×). In the control group, the regenerating livers were edematous and showed ballooned hepatocytes (C, arrow). In addition, the number of hepatocytes per high power field was lower in the control group than in the HBO group.
- Citation: Idetsu A, Suehiro T, Okada K, Shimura T, Kuwano H. Hyperbaric oxygenation promotes regeneration of biliary cells and improves cholestasis in rats. World J Gastroenterol 2011; 17(17): 2229-2235
- URL: https://www.wjgnet.com/1007-9327/full/v17/i17/2229.htm
- DOI: https://dx.doi.org/10.3748/wjg.v17.i17.2229


