Copyright
©2011 Baishideng Publishing Group Co.
World J Gastroenterol. Apr 21, 2011; 17(15): 2044-2048
Published online Apr 21, 2011. doi: 10.3748/wjg.v17.i15.2044
Published online Apr 21, 2011. doi: 10.3748/wjg.v17.i15.2044
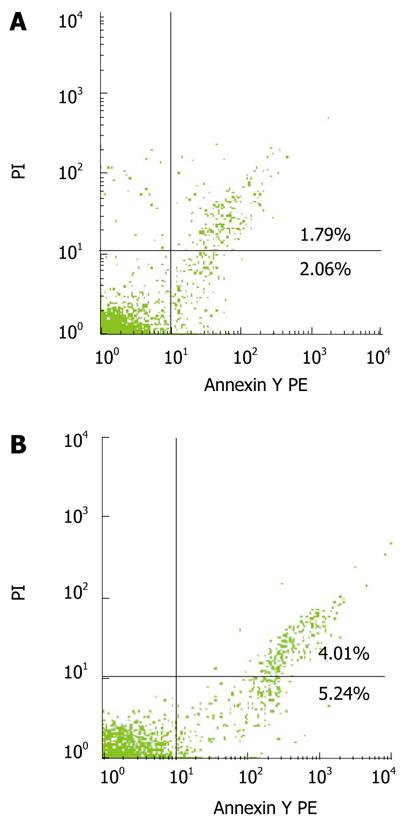
Figure 3 Scatter plot showing percentages of early and late apoptotic bone marrow CD34+ cells in control group (A) and cirrhosis group (B).
- Citation: Dang SS, Wang WJ, Gao N, Wang SD, Li M, Liu LY, Sun MZ, Dong T. Apoptotic bone marrow CD34+ cells in cirrhotic patients. World J Gastroenterol 2011; 17(15): 2044-2048
- URL: https://www.wjgnet.com/1007-9327/full/v17/i15/2044.htm
- DOI: https://dx.doi.org/10.3748/wjg.v17.i15.2044


