Copyright
©2011 Baishideng Publishing Group Co.
World J Gastroenterol. Apr 7, 2011; 17(13): 1772-1778
Published online Apr 7, 2011. doi: 10.3748/wjg.v17.i13.1772
Published online Apr 7, 2011. doi: 10.3748/wjg.v17.i13.1772
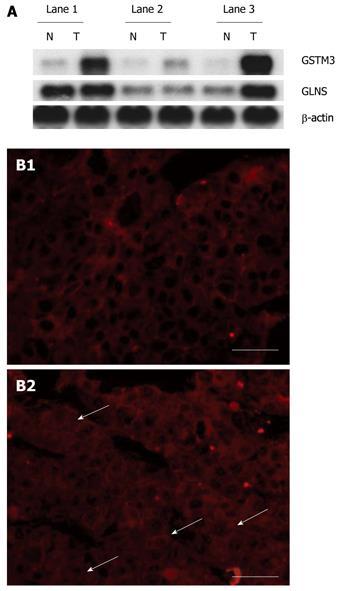
Figure 2 Levels of glutamine synthetase and glutathione-s-transferase M3 mRNA and expression of β-catenin.
A: T denotes surgically resected B6C3F1 mouse hepatocellular carcinoma (HCC) tissue samples and N denotes matched nontumorous liver tissue samples; B: Representative immunofluorescence photomicrographs for β-catenin (red photomicrographs) in HCC tissue samples. B1 denotes negative β-catenin staining in nuclei of HCC cells, B2 denotes positive β-catenin staining in nuclei of HCC cells, and white arrows indicate β-catenin detected in nuclei of HCC cells. Bars: 50 μm. GLNS: Glutamine synthetase; GSTM3: Glutathione-s-transferase M3.
- Citation: Li YS, Liu M, Nakata Y, Tang HB. β-catenin accumulation in nuclei of hepatocellular carcinoma cells up-regulates glutathione-s-transferase M3 mRNA. World J Gastroenterol 2011; 17(13): 1772-1778
- URL: https://www.wjgnet.com/1007-9327/full/v17/i13/1772.htm
- DOI: https://dx.doi.org/10.3748/wjg.v17.i13.1772


