Copyright
©2011 Baishideng Publishing Group Co.
World J Gastroenterol. Mar 28, 2011; 17(12): 1574-1583
Published online Mar 28, 2011. doi: 10.3748/wjg.v17.i12.1574
Published online Mar 28, 2011. doi: 10.3748/wjg.v17.i12.1574
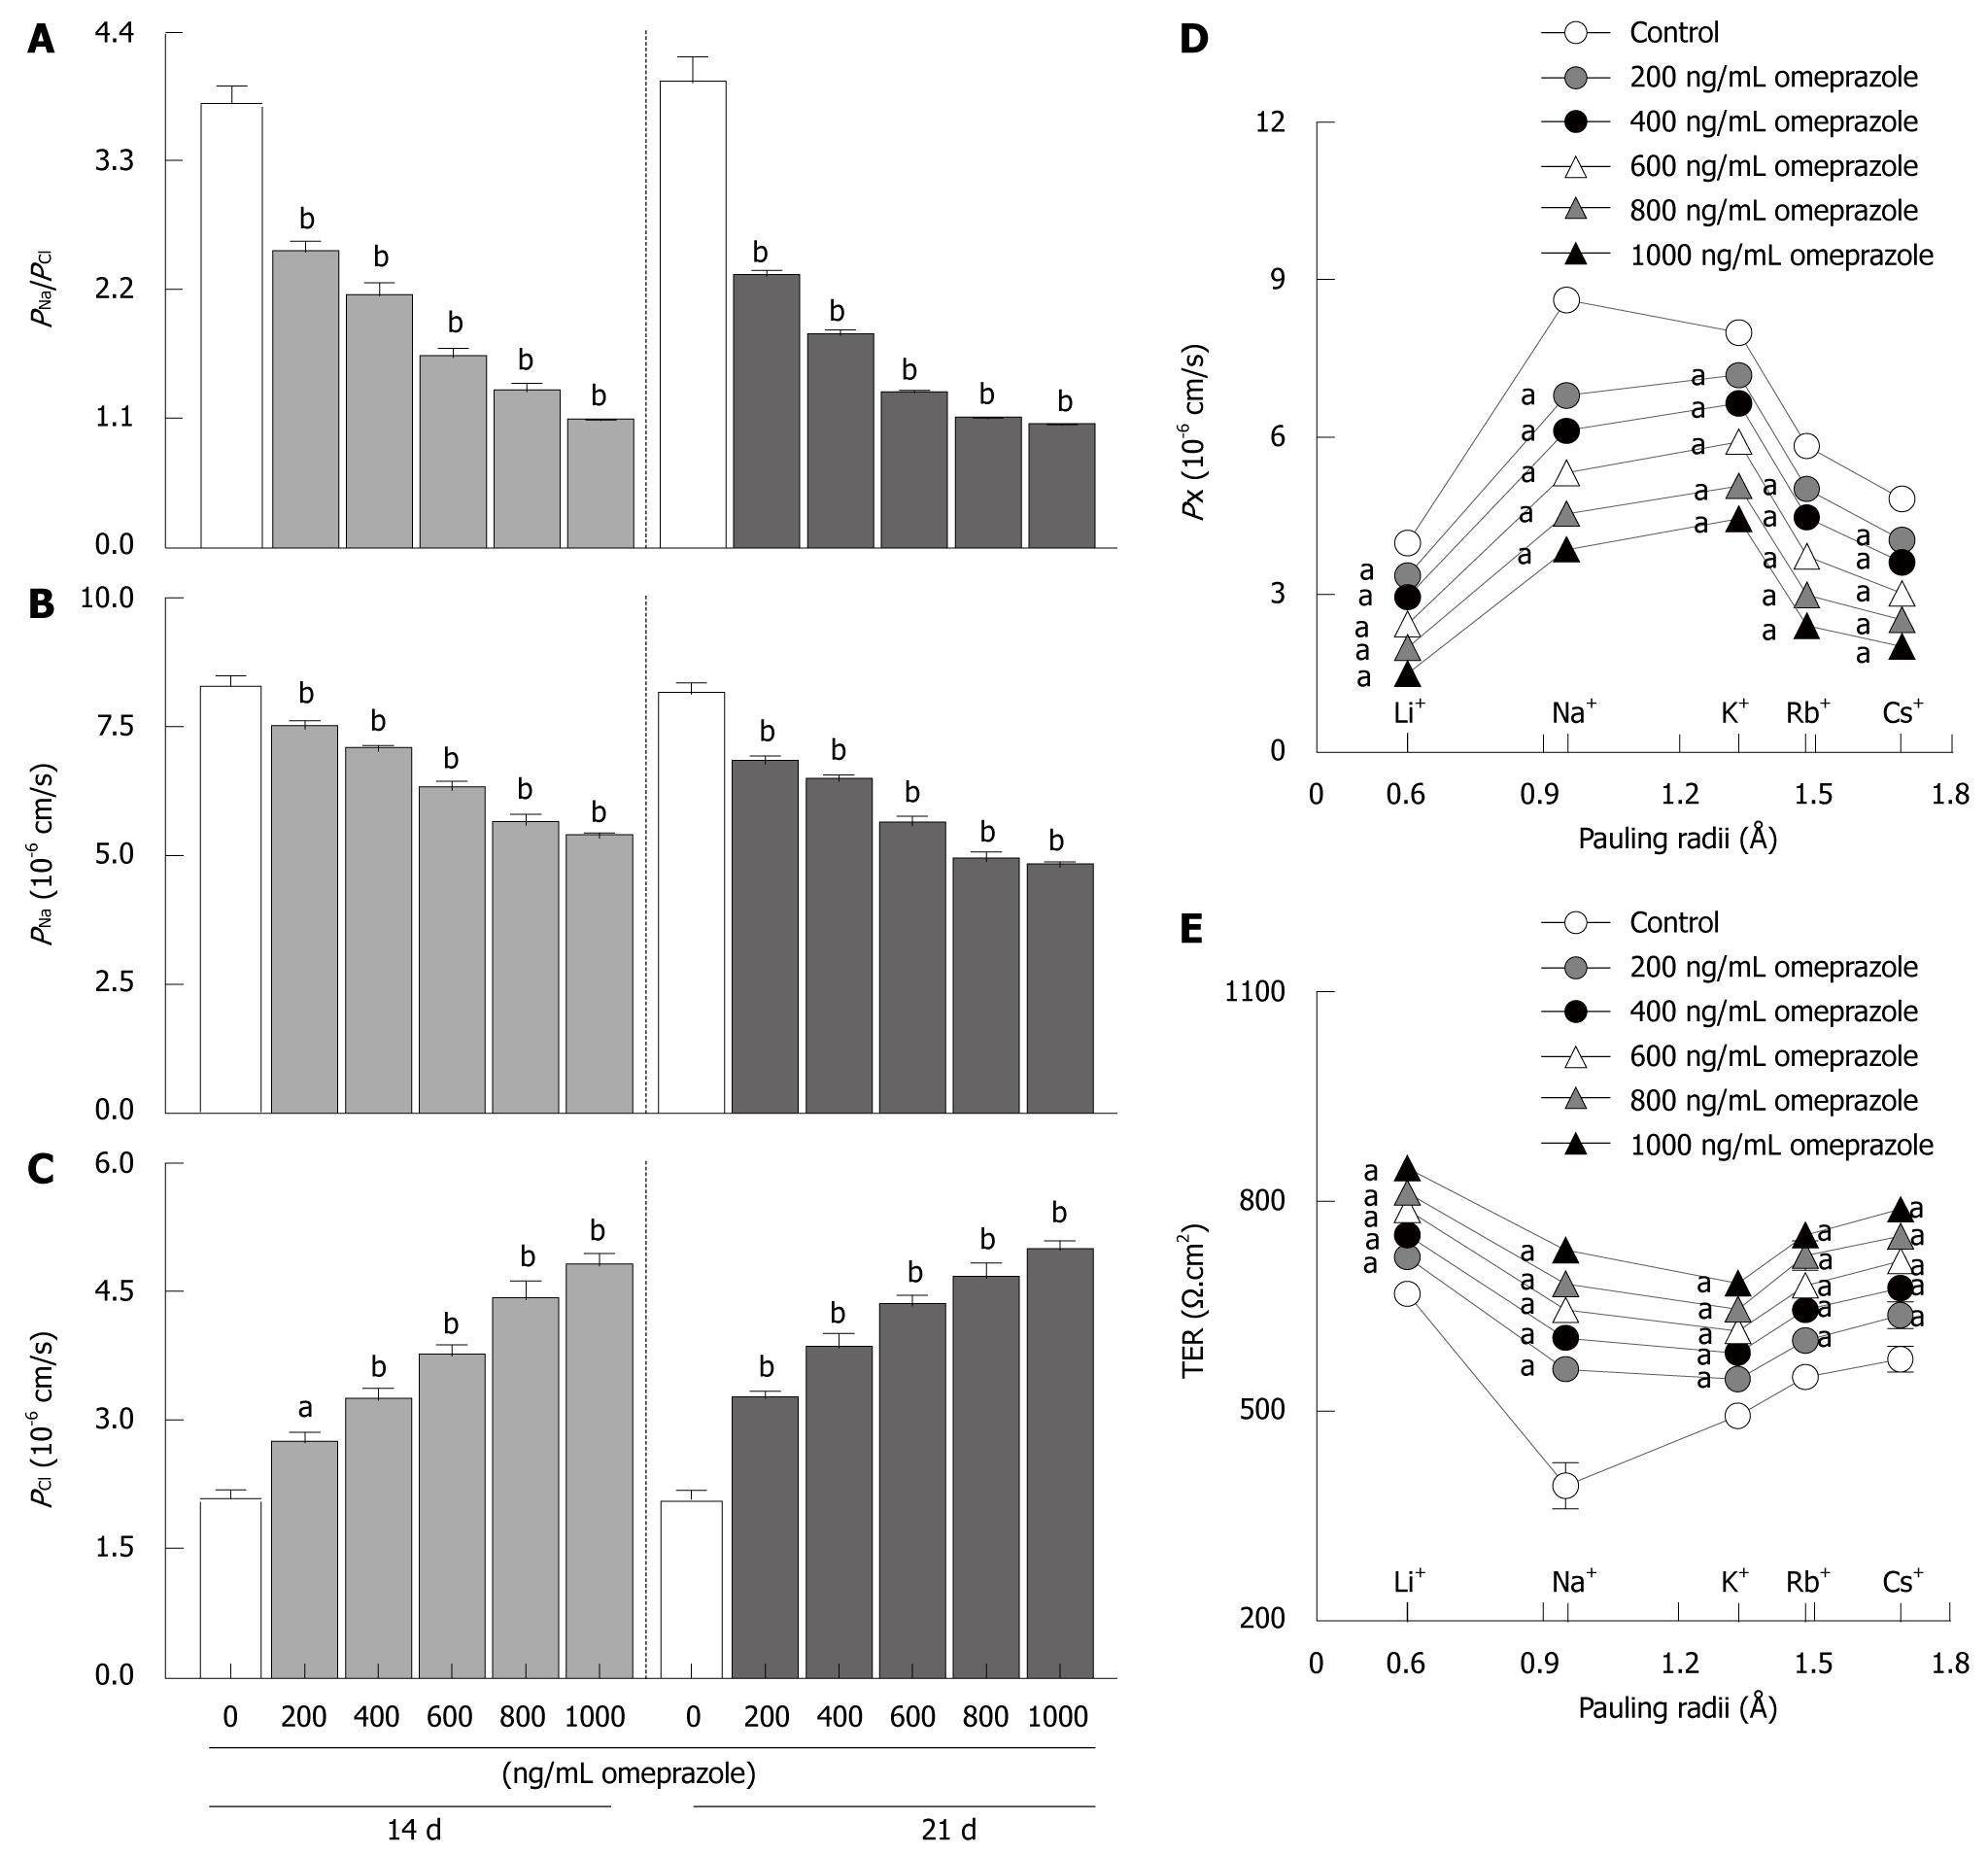
Figure 4 Paracellular charge selectivity and selective permeability profile.
A: PNa/PCl; B: PNa; C: PCl of 14 and 21 d control and various dose omeprazole-treated monolayers; D: Absolute alkaline metal ions (Li+, Na+, K+, Rb+, and Cs+) permeability; E: Trans-epithelium resistance (TER) of 14 d control and 600 ng/mL omeprazole-treated monolayers. aP < 0.05, bP < 0.01 vs the age matched control group. For each data point, n = 6.
- Citation: Thongon N, Krishnamra N. Omeprazole decreases magnesium transport across Caco-2 monolayers. World J Gastroenterol 2011; 17(12): 1574-1583
- URL: https://www.wjgnet.com/1007-9327/full/v17/i12/1574.htm
- DOI: https://dx.doi.org/10.3748/wjg.v17.i12.1574


