Copyright
©2011 Baishideng Publishing Group Co.
World J Gastroenterol. Mar 14, 2011; 17(10): 1267-1275
Published online Mar 14, 2011. doi: 10.3748/wjg.v17.i10.1267
Published online Mar 14, 2011. doi: 10.3748/wjg.v17.i10.1267
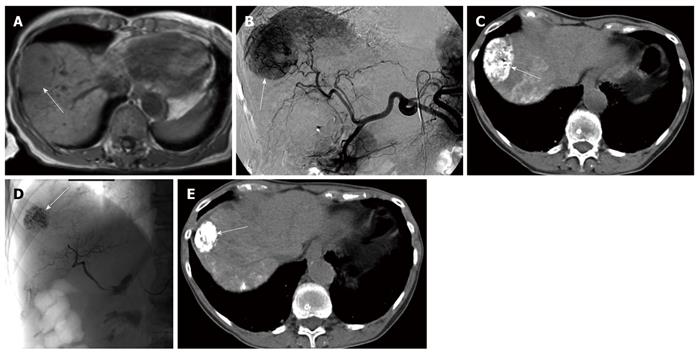
Figure 5 A 76-year-old female patient, hepatitis C virus liver cirrhosis.
A: Axial magnetic resonance imaging (MRI) T1 WI showing an isointense subcapsular hepatocellular carcinoma at segment 8 (white arrow); B: Digital subtraction angiography before the 1st transarterial chemoembolization (TACE) showing a large tumor blush at segment 8 (white arrow); C: Computed tomography (CT) after the first embolization showing dense Lipiodol uptake by the tumor (white arrow); D: Hepatic arteriography after the 5th TACE session showing occluded feeding arteries and Lipiodol concentration within the tumor (white arrow); E: CT after the last TACE session showing reduction of the tumor size (> 50%) by MRI volumetry (white arrow).
- Citation: Vogl TJ, Nour-Eldin NE, Emad-Eldin S, Naguib NN, Trojan J, Ackermann H, Abdelaziz O. Portal vein thrombosis and arterioportal shunts: Effects on tumor response after chemoembolization of hepatocellular carcinoma. World J Gastroenterol 2011; 17(10): 1267-1275
- URL: https://www.wjgnet.com/1007-9327/full/v17/i10/1267.htm
- DOI: https://dx.doi.org/10.3748/wjg.v17.i10.1267


