Copyright
©2011 Baishideng Publishing Group Co.
World J Gastroenterol. Jan 7, 2011; 17(1): 53-62
Published online Jan 7, 2011. doi: 10.3748/wjg.v17.i1.53
Published online Jan 7, 2011. doi: 10.3748/wjg.v17.i1.53
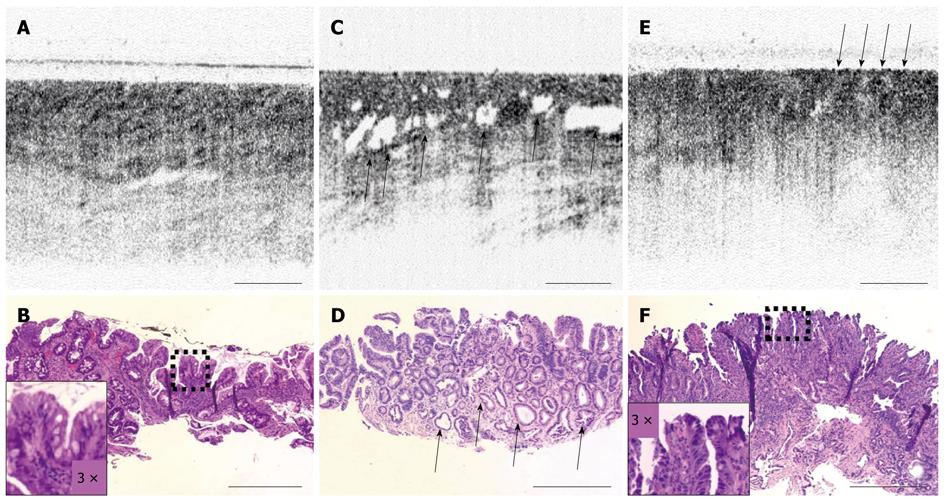
Figure 2 Optical coherence tomography images of intestinal metaplasia (A), and of neoplasia (C, E) are shown with corresponding histological images shown below [Copyright (2006), with permission from Elsevier][43], dilated glands (C) and increased surface reflectivity (E) can be seen in the optical coherence tomography images of neoplastic tissue, corresponding histopathology is shown (B, D, F).
Scale bars, 500 μm.
- Citation: Thekkek N, Anandasabapathy S, Richards-Kortum R. Optical molecular imaging for detection of Barrett’s-associated neoplasia. World J Gastroenterol 2011; 17(1): 53-62
- URL: https://www.wjgnet.com/1007-9327/full/v17/i1/53.htm
- DOI: https://dx.doi.org/10.3748/wjg.v17.i1.53


