Copyright
©2011 Baishideng Publishing Group Co.
World J Gastroenterol. Jan 7, 2011; 17(1): 28-41
Published online Jan 7, 2011. doi: 10.3748/wjg.v17.i1.28
Published online Jan 7, 2011. doi: 10.3748/wjg.v17.i1.28
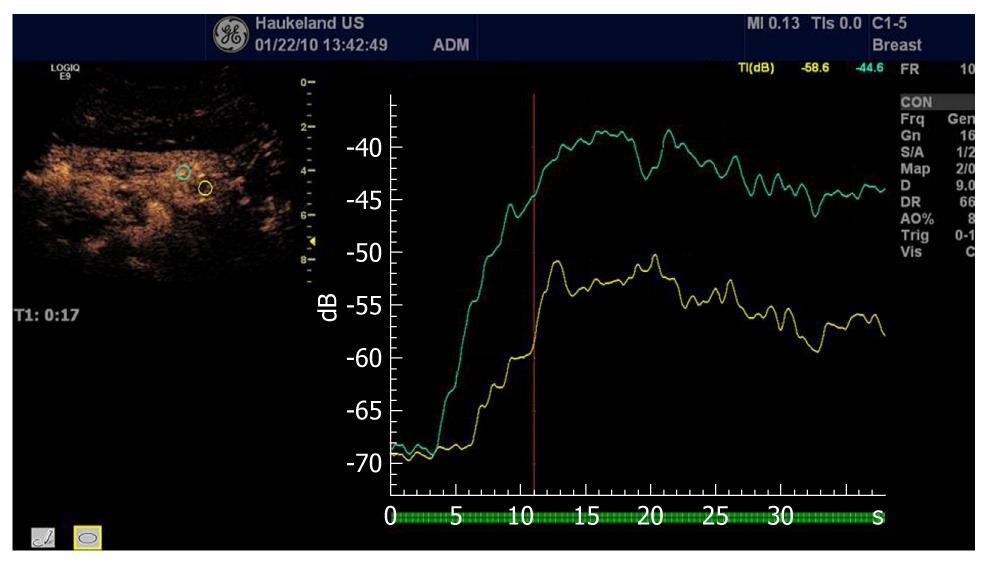
Figure 15 Analysis of time intensity curves after injection of contrast agents depicting a pancreatic carcinoma (same as Figure 13).
The green curve depicts the normal pancreatic perfusion whereas the red curve illustrates the hypoenhancing malignancy.
- Citation: Postema M, Gilja OH. Contrast-enhanced and targeted ultrasound. World J Gastroenterol 2011; 17(1): 28-41
- URL: https://www.wjgnet.com/1007-9327/full/v17/i1/28.htm
- DOI: https://dx.doi.org/10.3748/wjg.v17.i1.28


