Copyright
©2010 Baishideng.
World J Gastroenterol. Feb 28, 2010; 16(8): 966-972
Published online Feb 28, 2010. doi: 10.3748/wjg.v16.i8.966
Published online Feb 28, 2010. doi: 10.3748/wjg.v16.i8.966
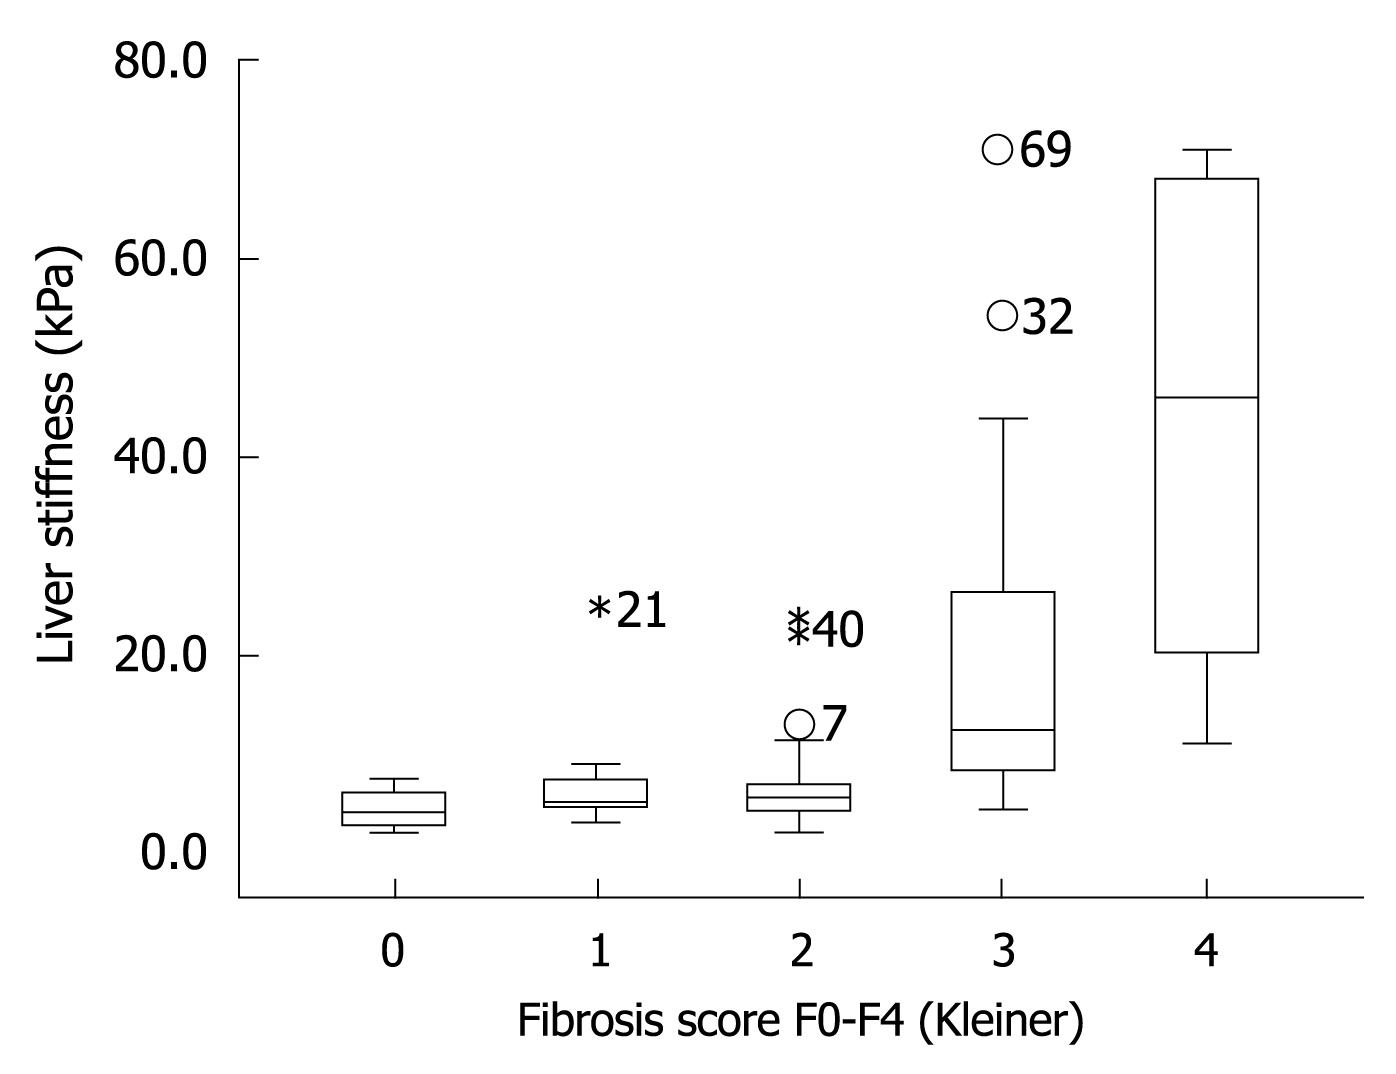
Figure 4 Box blot showing LS as a function of fibrosis stages F0-F4.
A significant increase in LS is seen from fibrosis stage F3 onwards. The length of the box represents the interquartile range within which 50% of the values were located. The line through the middle of each box represents the median. The error bars show the minimum and maximum values (range). Numbered symbols represent out-of-range patients excluded by the box plot.
- Citation: Mueller S, Millonig G, Sarovska L, Friedrich S, Reimann FM, Pritsch M, Eisele S, Stickel F, Longerich T, Schirmacher P, Seitz HK. Increased liver stiffness in alcoholic liver disease: Differentiating fibrosis from steatohepatitis. World J Gastroenterol 2010; 16(8): 966-972
- URL: https://www.wjgnet.com/1007-9327/full/v16/i8/966.htm
- DOI: https://dx.doi.org/10.3748/wjg.v16.i8.966


