Copyright
©2010 Baishideng.
World J Gastroenterol. Feb 21, 2010; 16(7): 886-896
Published online Feb 21, 2010. doi: 10.3748/wjg.v16.i7.886
Published online Feb 21, 2010. doi: 10.3748/wjg.v16.i7.886
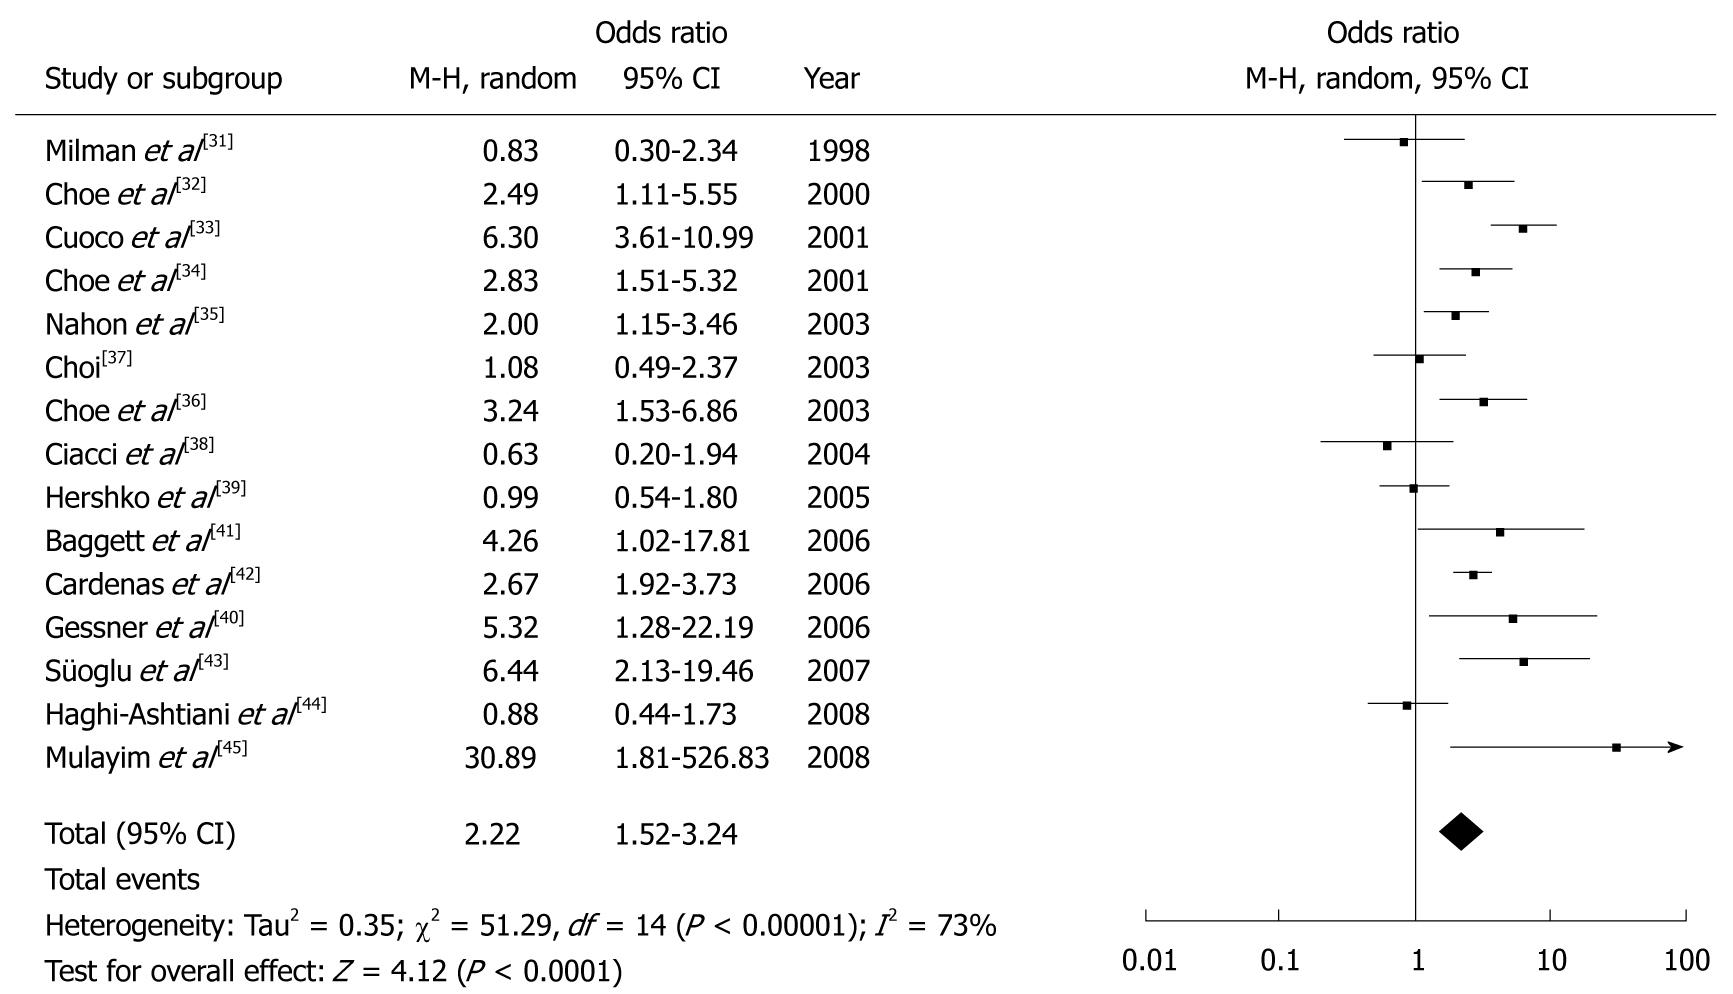
Figure 2 Forest plot of the observational studies.
M-H, Random: Mantel-Haenszel heterogeneity random effects model. Horizontal lines = 95% CI. The rectangles represent the point estimates of the study and the size of the rectangle represents the weight given to each study in the meta-analysis. The diamond represents the summary estimate; the size of the diamond represents the CIs of the summary estimate.
-
Citation: Qu XH, Huang XL, Xiong P, Zhu CY, Huang YL, Lu LG, Sun X, Rong L, Zhong L, Sun DY, Lin H, Cai MC, Chen ZW, Hu B, Wu LM, Jiang YB, Yan WL. Does
Helicobacter pylori infection play a role in iron deficiency anemia? A meta-analysis. World J Gastroenterol 2010; 16(7): 886-896 - URL: https://www.wjgnet.com/1007-9327/full/v16/i7/886.htm
- DOI: https://dx.doi.org/10.3748/wjg.v16.i7.886


