Copyright
©2010 Baishideng.
World J Gastroenterol. Feb 21, 2010; 16(7): 875-880
Published online Feb 21, 2010. doi: 10.3748/wjg.v16.i7.875
Published online Feb 21, 2010. doi: 10.3748/wjg.v16.i7.875
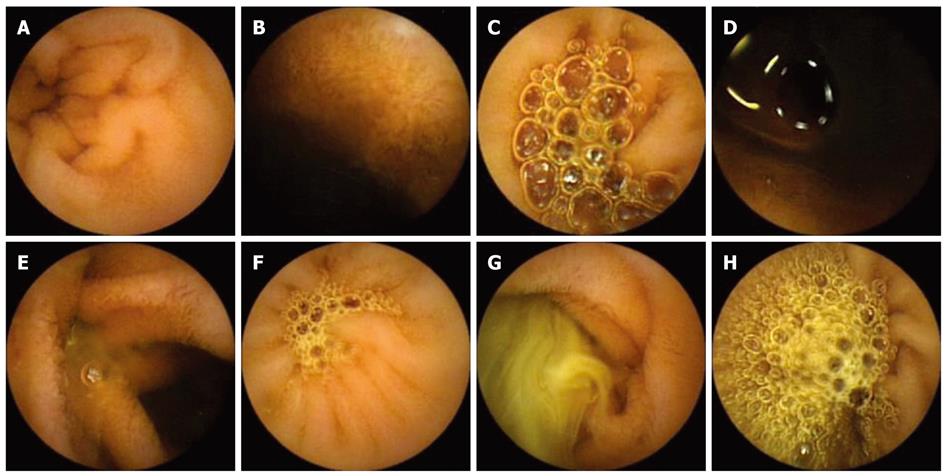
Figure 1 Images of scores according to the proportion of the visualized mucosa (A-D) and the degree of obscuration (E-H).
A: Score 3; B: Score 2; C: Score 1; D: Score 0; E: Score 3; F: Score 2; G: Score 1; H: Score 0.
- Citation: Park SC, Keum B, Hyun JJ, Seo YS, Kim YS, Jeen YT, Chun HJ, Um SH, Kim CD, Ryu HS. A novel cleansing score system for capsule endoscopy. World J Gastroenterol 2010; 16(7): 875-880
- URL: https://www.wjgnet.com/1007-9327/full/v16/i7/875.htm
- DOI: https://dx.doi.org/10.3748/wjg.v16.i7.875


