Copyright
©2010 Baishideng.
World J Gastroenterol. Feb 14, 2010; 16(6): 703-712
Published online Feb 14, 2010. doi: 10.3748/wjg.v16.i6.703
Published online Feb 14, 2010. doi: 10.3748/wjg.v16.i6.703
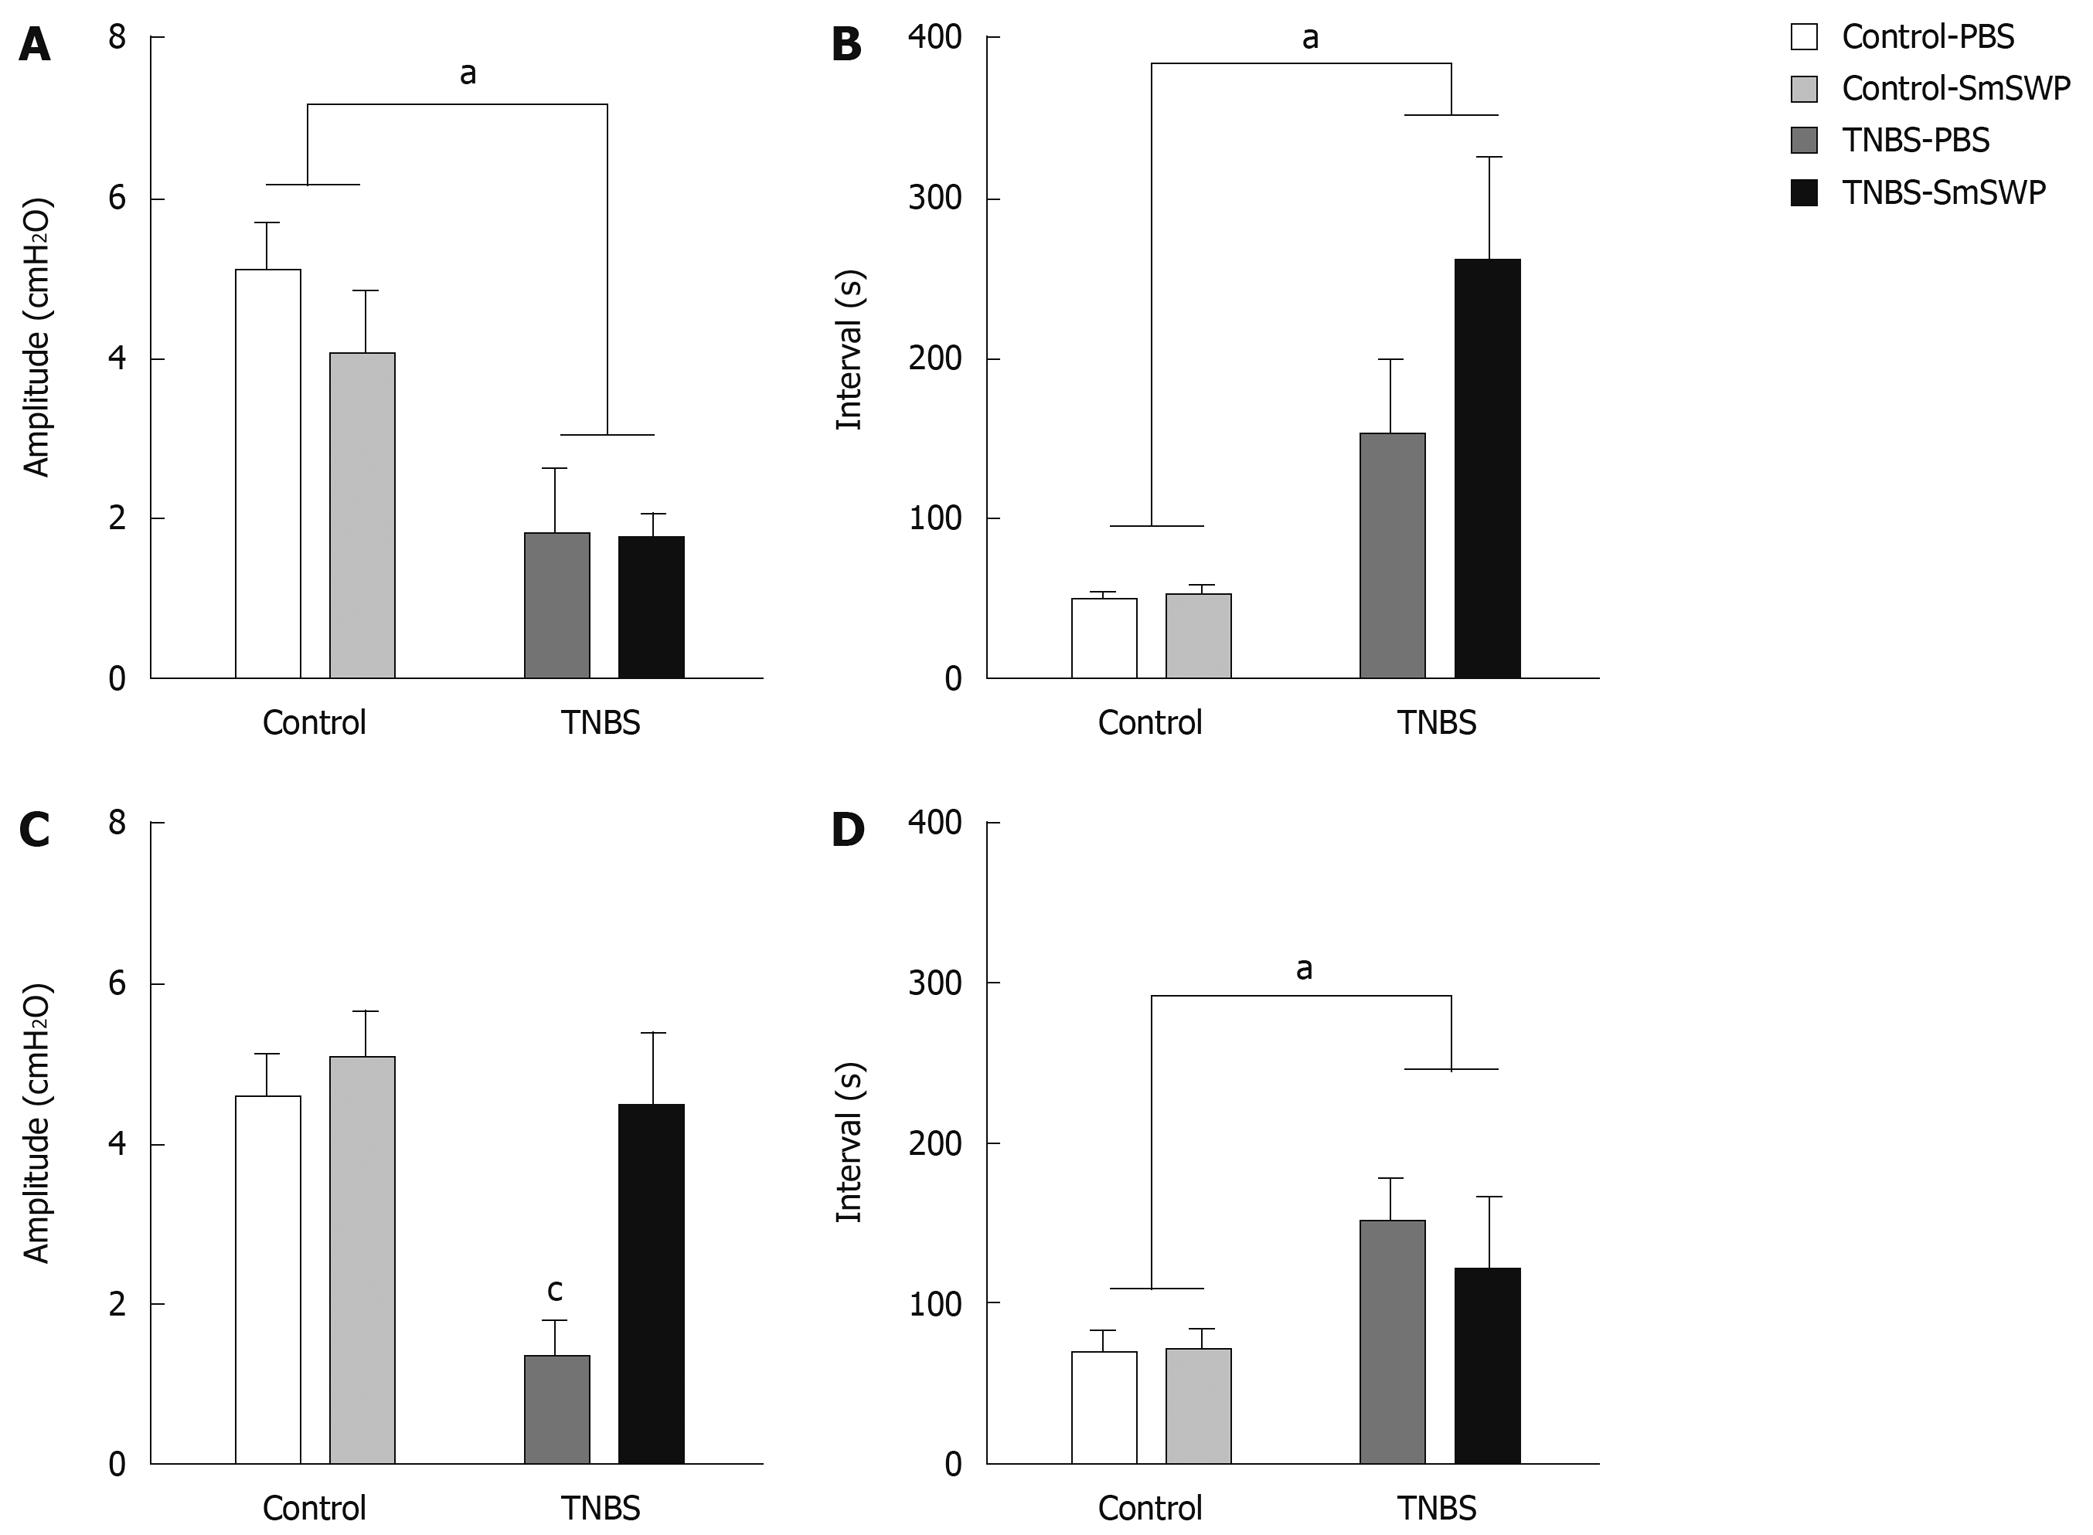
Figure 4 Effect of 25 μg S.
mansoni proteins on the amplitude and interval of peristaltic waves 3 d (A, B) and 5 d (C, D) after the induction of colitis. Data are presented as mean ± SE. Data were analyzed by two-way ANOVA with SNK post hoc test; n = 7-9 (except for the TNBS-PBS group on day 3 n = 4) ; aP≤ 0.05, significant colitis effect; cP≤ 0.05, post hoc analysis showed a significant difference from the other 3 groups.
-
Citation: Ruyssers NE, De Winter BY, De Man JG, Ruyssers ND, Van Gils AJ, Loukas A, Pearson MS, Weinstock JV, Pelckmans PA, Moreels TG.
Schistosoma mansoni proteins attenuate gastrointestinal motility disturbances during experimental colitis in mice. World J Gastroenterol 2010; 16(6): 703-712 - URL: https://www.wjgnet.com/1007-9327/full/v16/i6/703.htm
- DOI: https://dx.doi.org/10.3748/wjg.v16.i6.703


