Copyright
©2010 Baishideng.
World J Gastroenterol. Feb 7, 2010; 16(5): 618-624
Published online Feb 7, 2010. doi: 10.3748/wjg.v16.i5.618
Published online Feb 7, 2010. doi: 10.3748/wjg.v16.i5.618
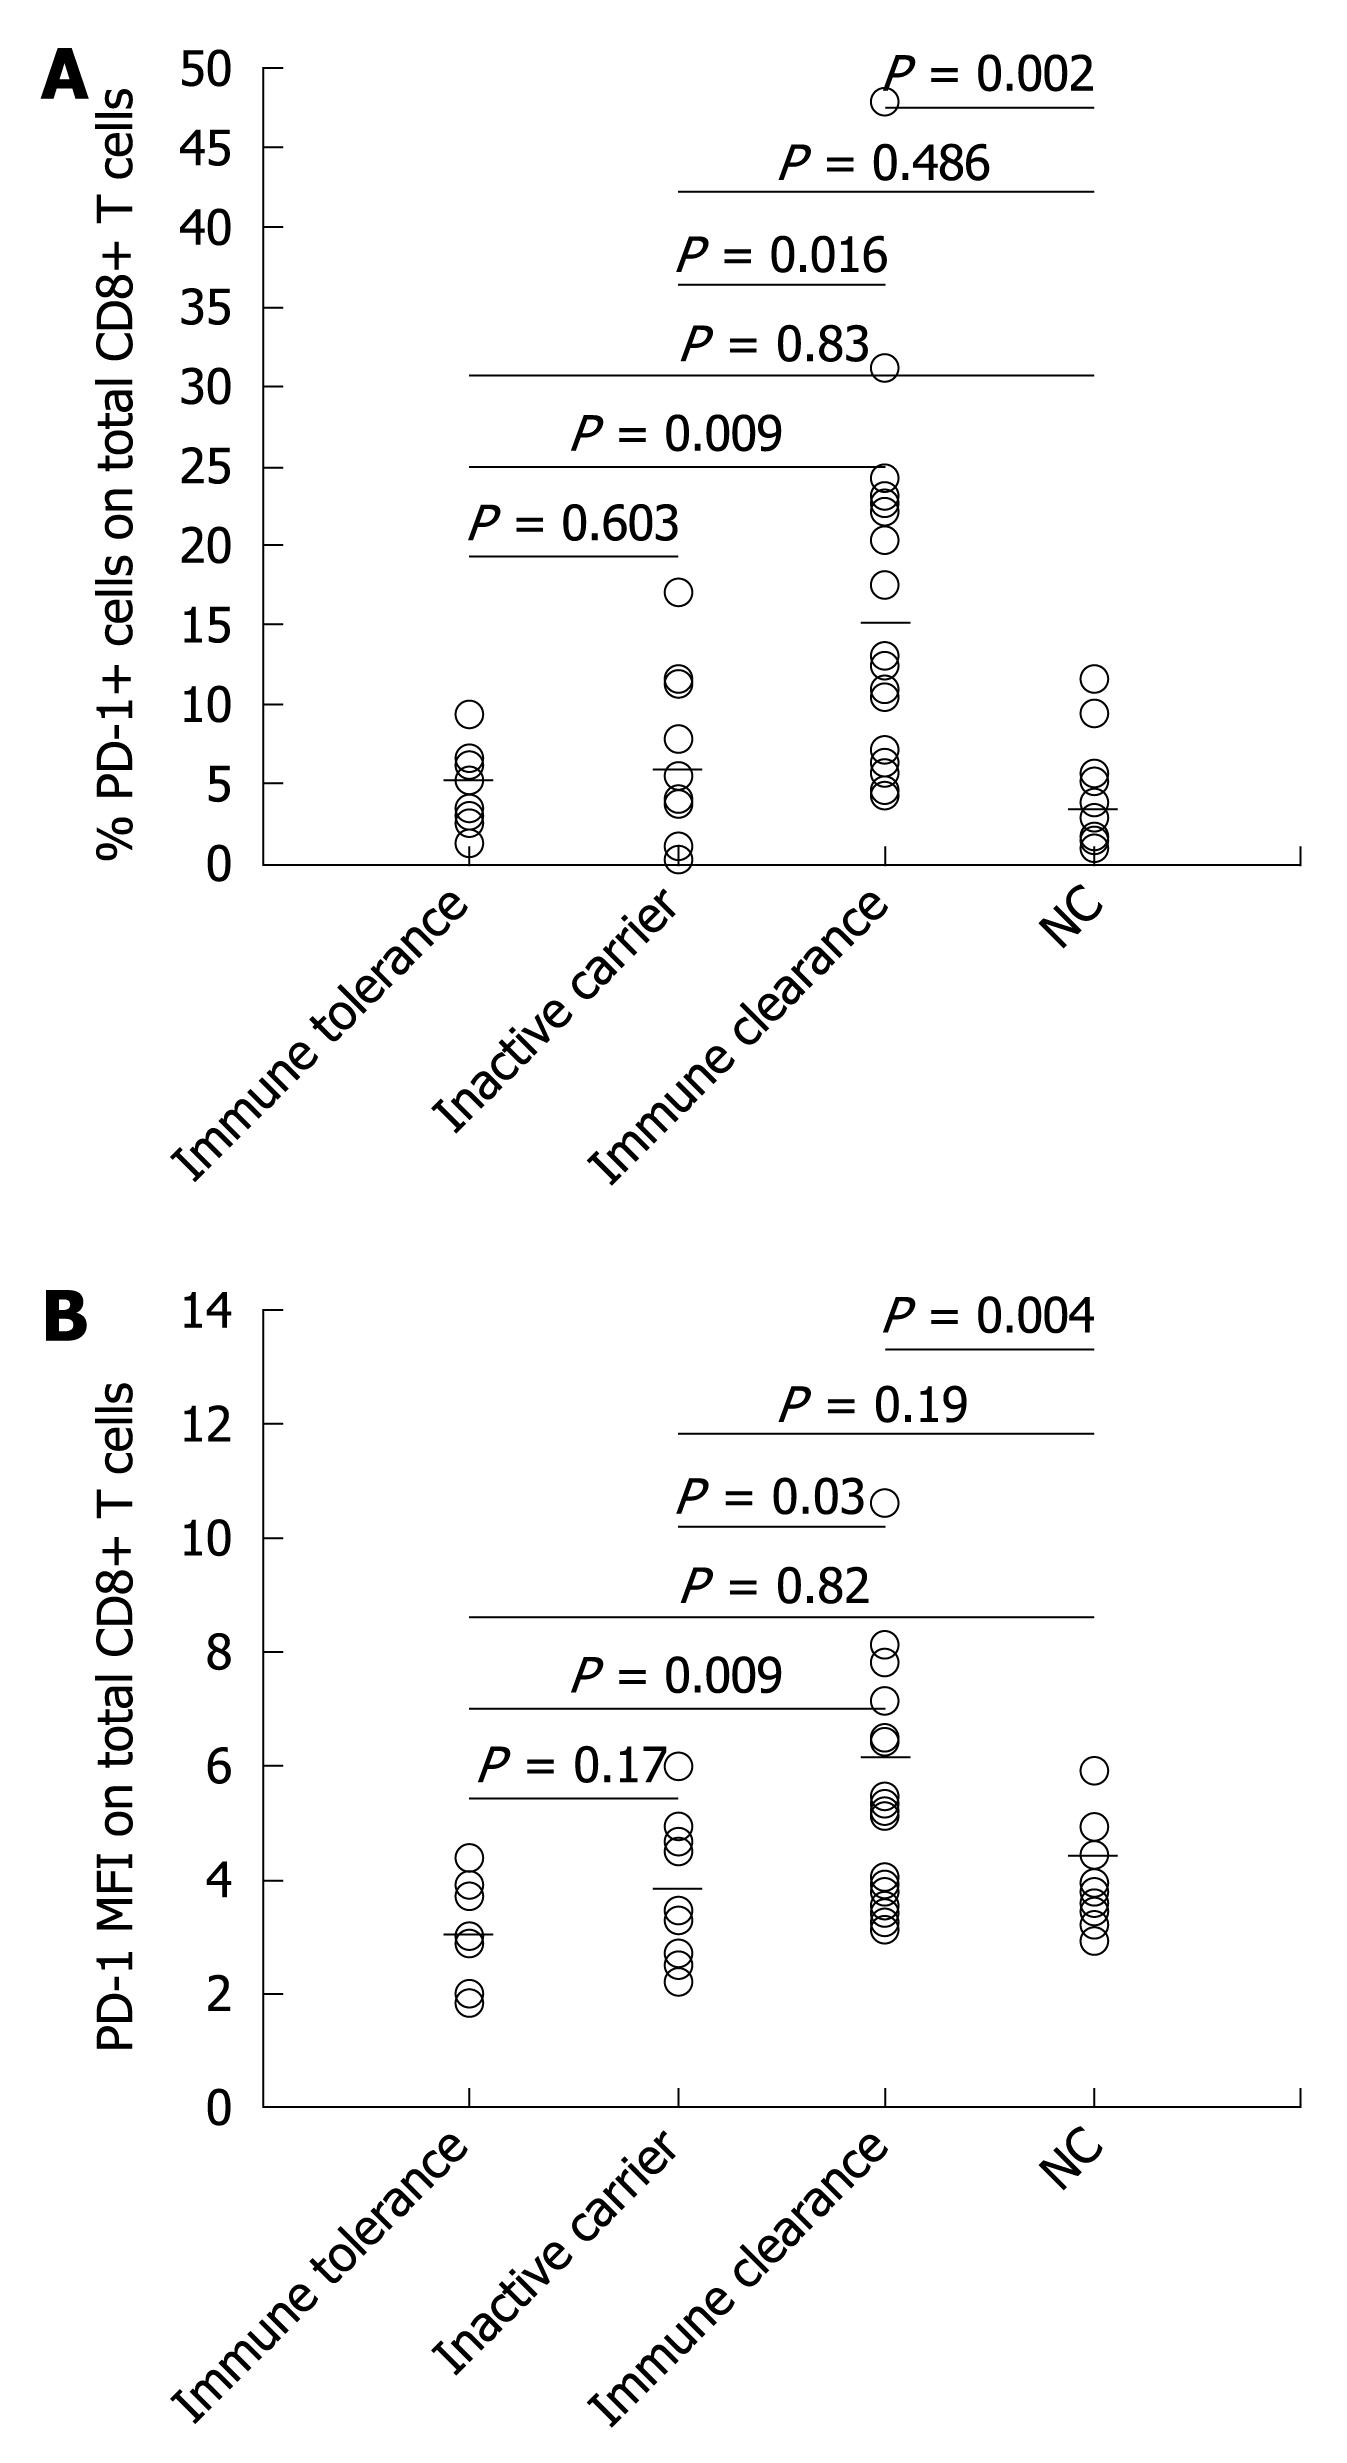
Figure 1 Programmed death type-1 (PD-1) expression in total peripheral CD8+ T cells in the natural stages of chronic hepatitis B virus (HBV) infection.
A: The dot plots showing the percentage of PD-1+ CD8+ T cells in different natural stages of chronic HBV infection patients and normal controls and the horizontal bars indicating the median percentage of positive PD-1 in CD8+ T cells; B: The dot plots showing the PD-1 mean fluorescence intensity (MFI) expression in total CD8+ T cells, and the horizontal bars indicating the median PD-1 MFI expression level in CD8+ T cells. NC: Normal control.
- Citation: Liang XS, Zhou Y, Li CZ, Wan MB. Natural course of chronic hepatitis B is characterized by changing patterns of programmed death type-1 of CD8-positive T cells. World J Gastroenterol 2010; 16(5): 618-624
- URL: https://www.wjgnet.com/1007-9327/full/v16/i5/618.htm
- DOI: https://dx.doi.org/10.3748/wjg.v16.i5.618


