Copyright
©2010 Baishideng Publishing Group Co.
World J Gastroenterol. Dec 28, 2010; 16(48): 6145-6150
Published online Dec 28, 2010. doi: 10.3748/wjg.v16.i48.6145
Published online Dec 28, 2010. doi: 10.3748/wjg.v16.i48.6145
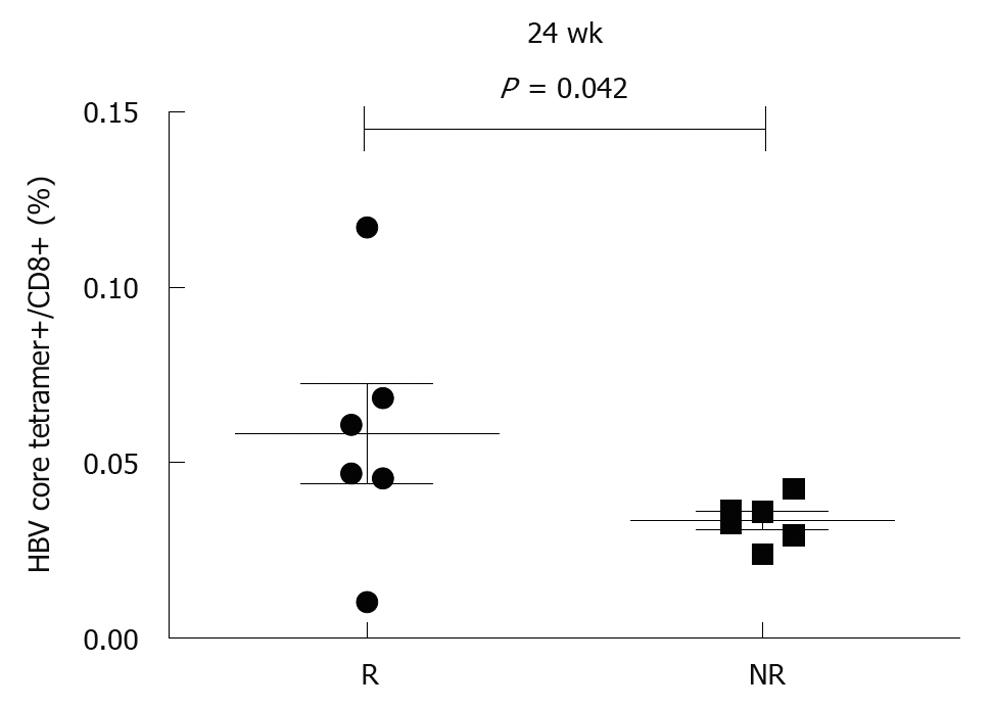
Figure 3 Correlation between increased hepatitis B virus specific T cells and treatment response 24 wk after therapy.
The frequency of hepatitis B virus (HBV) core epitope-specific CD8+ T cells at week 24 was higher in responders (R) than in non-responders (NR).
- Citation: Chen J, Wang Y, Wu XJ, Li J, Hou FQ, Wang GQ. Pegylated interferon α-2b up-regulates specific CD8+ T cells in patients with chronic hepatitis B. World J Gastroenterol 2010; 16(48): 6145-6150
- URL: https://www.wjgnet.com/1007-9327/full/v16/i48/6145.htm
- DOI: https://dx.doi.org/10.3748/wjg.v16.i48.6145


