Copyright
©2010 Baishideng Publishing Group Co.
World J Gastroenterol. Dec 28, 2010; 16(48): 6111-6118
Published online Dec 28, 2010. doi: 10.3748/wjg.v16.i48.6111
Published online Dec 28, 2010. doi: 10.3748/wjg.v16.i48.6111
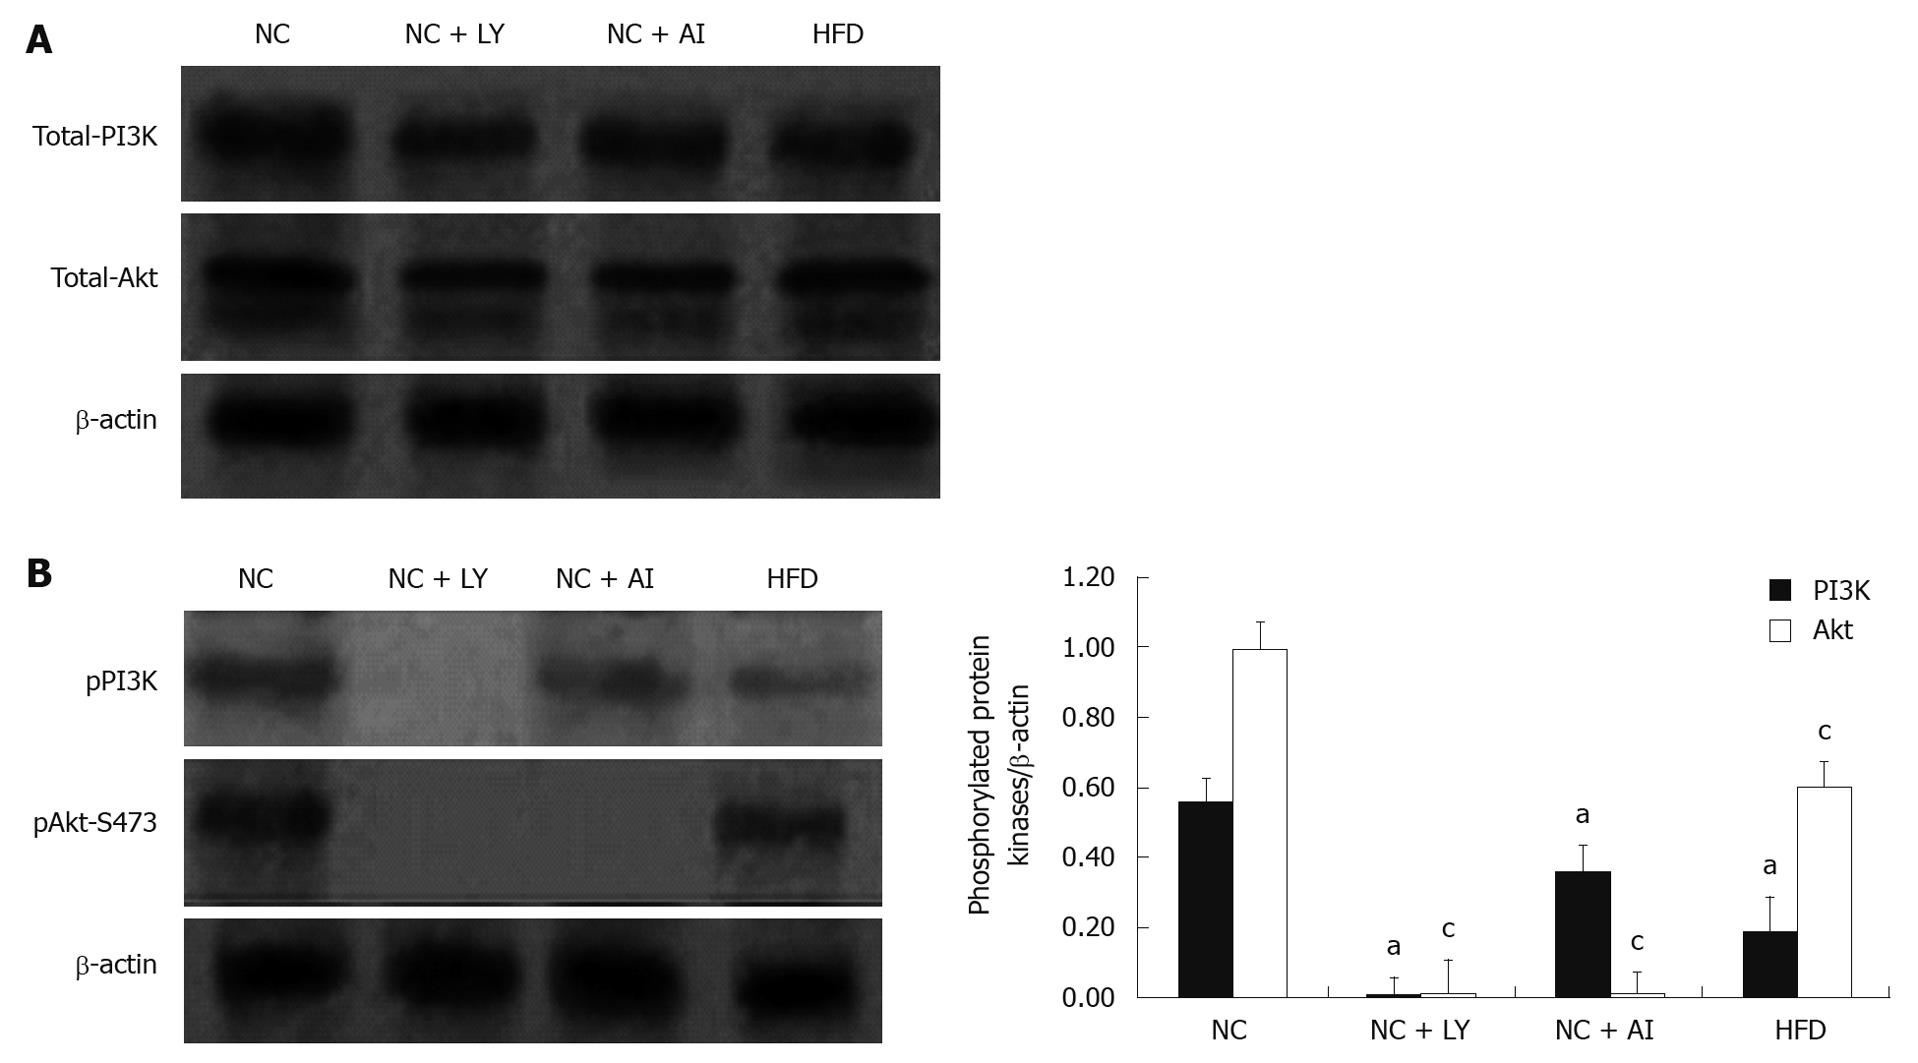
Figure 1 Western blotting analysis of phosphatidylinositol 3-kinase and protein kinase B in hepatocytes.
A: Western blotting analysis of total phosphatidylinositol 3-kinase (PI3K) and protein kinase B (Akt). The protein expression levels of total PI3K and Akt showed no significant difference among the four groups; B: Western blotting analysis of phosphorylated PI3K and Akt. Left: In high-fat fed groups (HFD), the protein expression levels of both phosphorylated PI3K and Akt decreased compared with the normal control (NC) group. In PI3K blocker groups (NC + LY), pPI3K and pAkt showed no expression. In AKT blocker groups (NC + AI), pPI3K was normally expressed and pAkt showed no expression. Right: Band density values are compared with those of the β-actin loading control. a,cP < 0.05 vs NC group.
- Citation: Han JW, Zhan XR, Li XY, Xia B, Wang YY, Zhang J, Li BX. Impaired PI3K/Akt signal pathway and hepatocellular injury in high-fat fed rats. World J Gastroenterol 2010; 16(48): 6111-6118
- URL: https://www.wjgnet.com/1007-9327/full/v16/i48/6111.htm
- DOI: https://dx.doi.org/10.3748/wjg.v16.i48.6111


