Copyright
©2010 Baishideng Publishing Group Co.
World J Gastroenterol. Dec 28, 2010; 16(48): 6104-6110
Published online Dec 28, 2010. doi: 10.3748/wjg.v16.i48.6104
Published online Dec 28, 2010. doi: 10.3748/wjg.v16.i48.6104
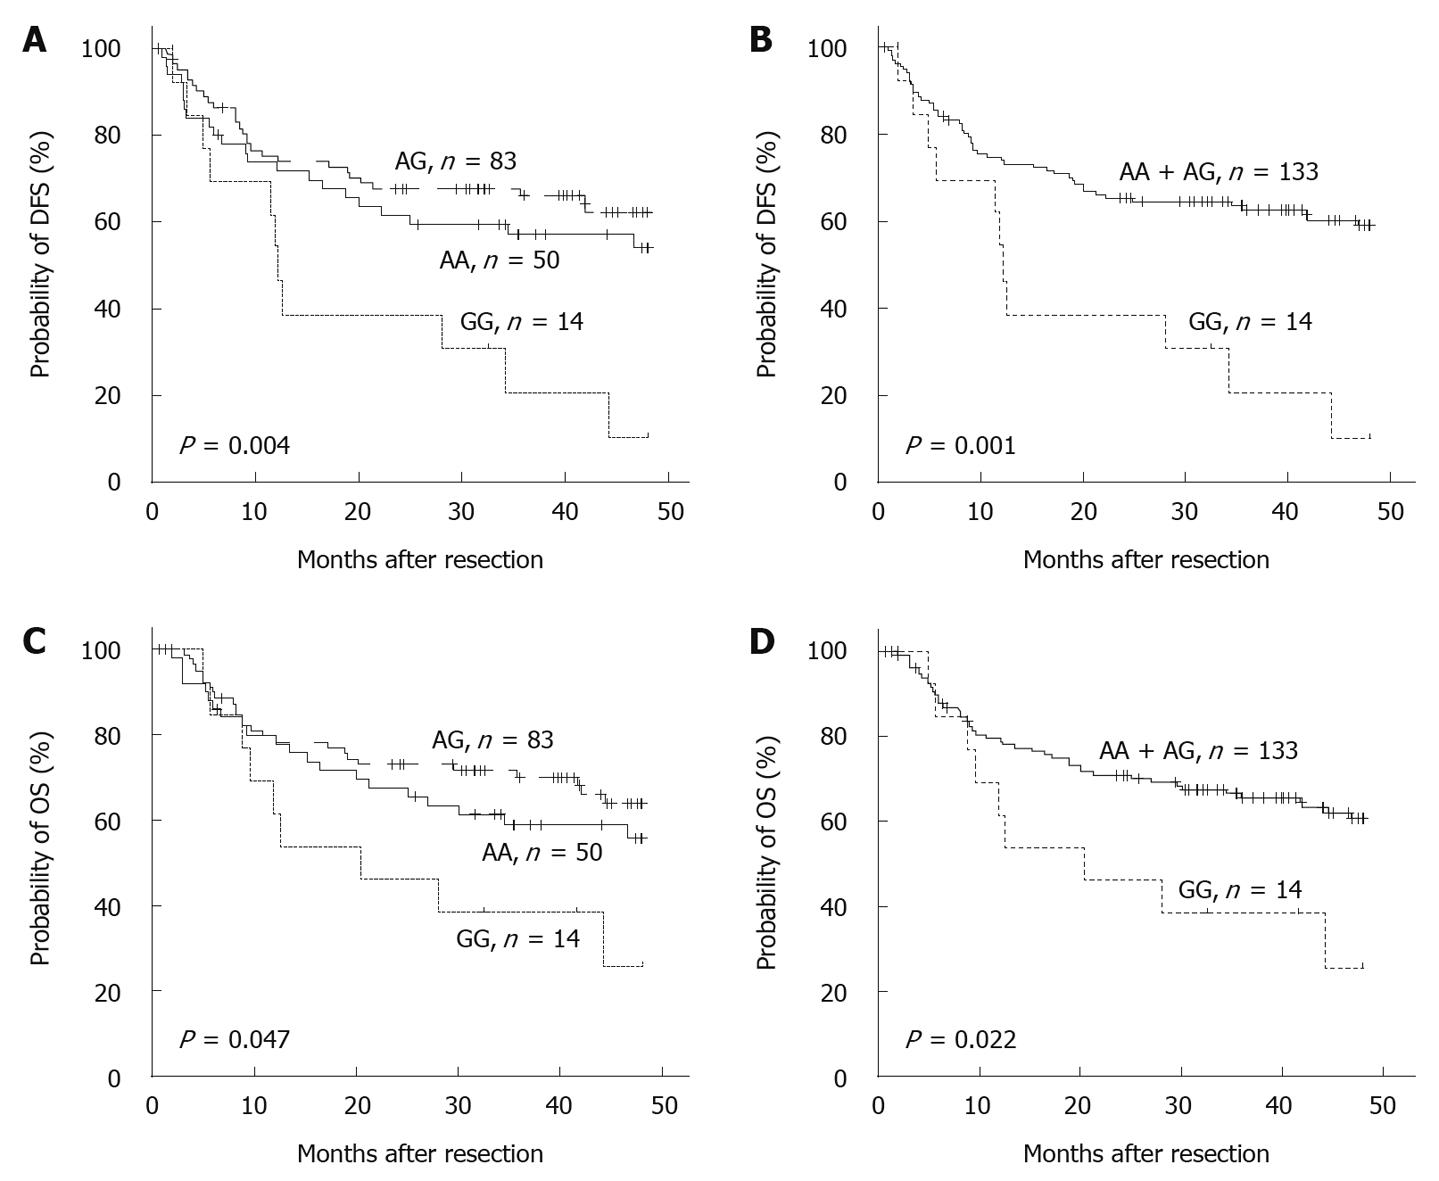
Figure 2 Kaplan-Meier curves for disease-free survival (A and B) and overall survival (C and D) for male patients with hepatocellular carcinoma and different multidrug resistance related protein-1 -1666 genotypes.
A: Comparison of disease-free survival (DFS) between three genotypes; B: AA and AG grouped together and compared to GG genotype; C: Comparison of overall survival (OS) between three genotypes; D: OS of AA and AG genotypes compared with GG genotype. Log-rank P values are indicated. Tick marks represent censored data.
- Citation: Zhao J, Yu BY, Wang DY, Yang JE. Promoter polymorphism of MRP1 associated with reduced survival in hepatocellular carcinoma. World J Gastroenterol 2010; 16(48): 6104-6110
- URL: https://www.wjgnet.com/1007-9327/full/v16/i48/6104.htm
- DOI: https://dx.doi.org/10.3748/wjg.v16.i48.6104


