Copyright
©2010 Baishideng Publishing Group Co.
World J Gastroenterol. Dec 21, 2010; 16(47): 5993-6000
Published online Dec 21, 2010. doi: 10.3748/wjg.v16.i47.5993
Published online Dec 21, 2010. doi: 10.3748/wjg.v16.i47.5993
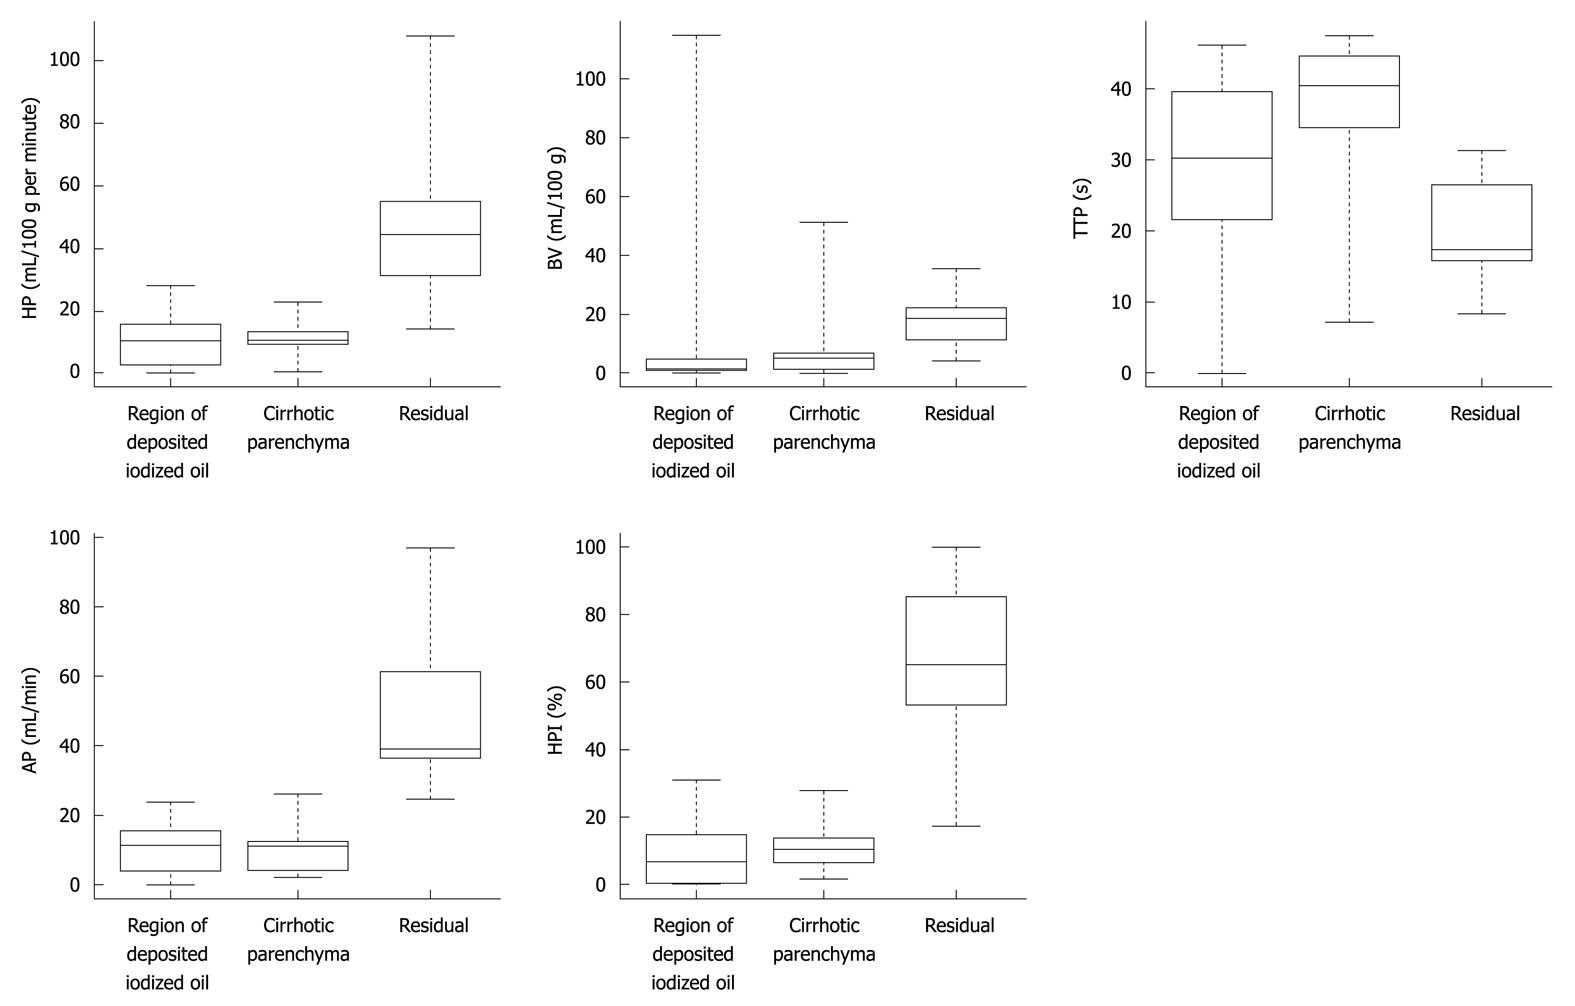
Figure 3 Box plots of the differences in perfusion parameters (hepatic perfusion, tissue blood volume, hepatic perfusion index, arterial perfusion, and time to peak).
The lower boundary of the boxes indicates the 25th percentile, line within the boxes marks the median, and the higher boundary of the boxes indicates the 75th percentile. Error bars below and above the boxes indicate minimum and maximum values. HP: Hepatic perfusion; BV: Blood volume; HPI: Hepatic perfusion index; AP: Arterial perfusion; TTP: Time to peak.
- Citation: Ippolito D, Bonaffini PA, Ratti L, Antolini L, Corso R, Fazio F, Sironi S. Hepatocellular carcinoma treated with transarterial chemoembolization: Dynamic perfusion-CT in the assessment of residual tumor. World J Gastroenterol 2010; 16(47): 5993-6000
- URL: https://www.wjgnet.com/1007-9327/full/v16/i47/5993.htm
- DOI: https://dx.doi.org/10.3748/wjg.v16.i47.5993


