Copyright
©2010 Baishideng Publishing Group Co.
World J Gastroenterol. Nov 21, 2010; 16(43): 5481-5489
Published online Nov 21, 2010. doi: 10.3748/wjg.v16.i43.5481
Published online Nov 21, 2010. doi: 10.3748/wjg.v16.i43.5481
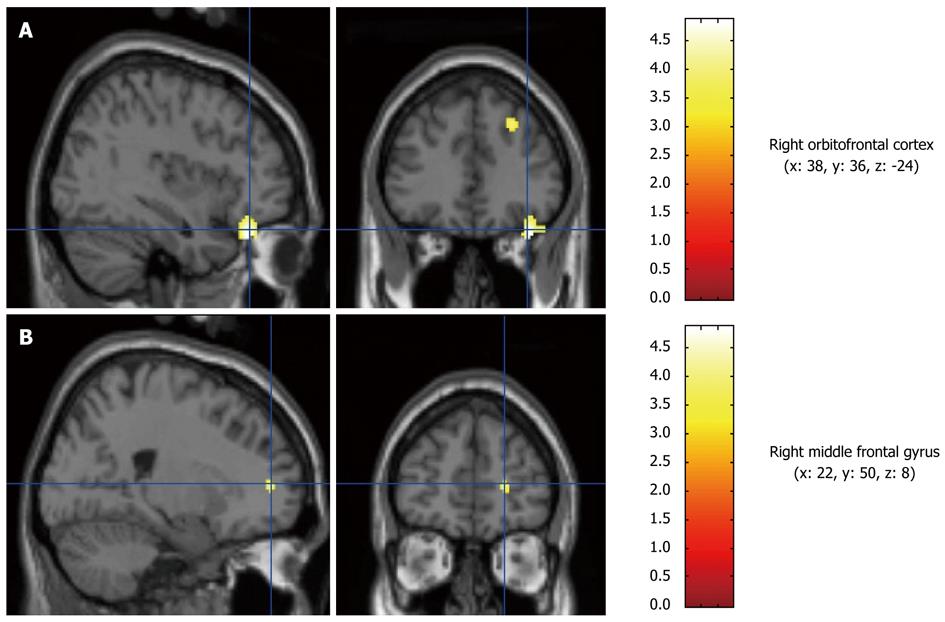
Figure 3 Representative images from the subtraction analysis of the second pH 1 infusion minus the first.
Left: Sagittal view; Right: Cranial view. A: Right orbitofrontal cortex (x: 38, y: 36, z: -24); B: Right middle frontal gyrus (x: 22, y: 50, z: 8).
- Citation: Kobayashi S, Abe Y, Tashiro M, Koike T, Iijima K, Imatani A, Ohara S, Watanabe S, Fukudo S, Shimosegawa T. Brain activity following esophageal acid infusion using positron emission tomography. World J Gastroenterol 2010; 16(43): 5481-5489
- URL: https://www.wjgnet.com/1007-9327/full/v16/i43/5481.htm
- DOI: https://dx.doi.org/10.3748/wjg.v16.i43.5481


