Copyright
©2010 Baishideng Publishing Group Co.
World J Gastroenterol. Oct 28, 2010; 16(40): 5057-5064
Published online Oct 28, 2010. doi: 10.3748/wjg.v16.i40.5057
Published online Oct 28, 2010. doi: 10.3748/wjg.v16.i40.5057
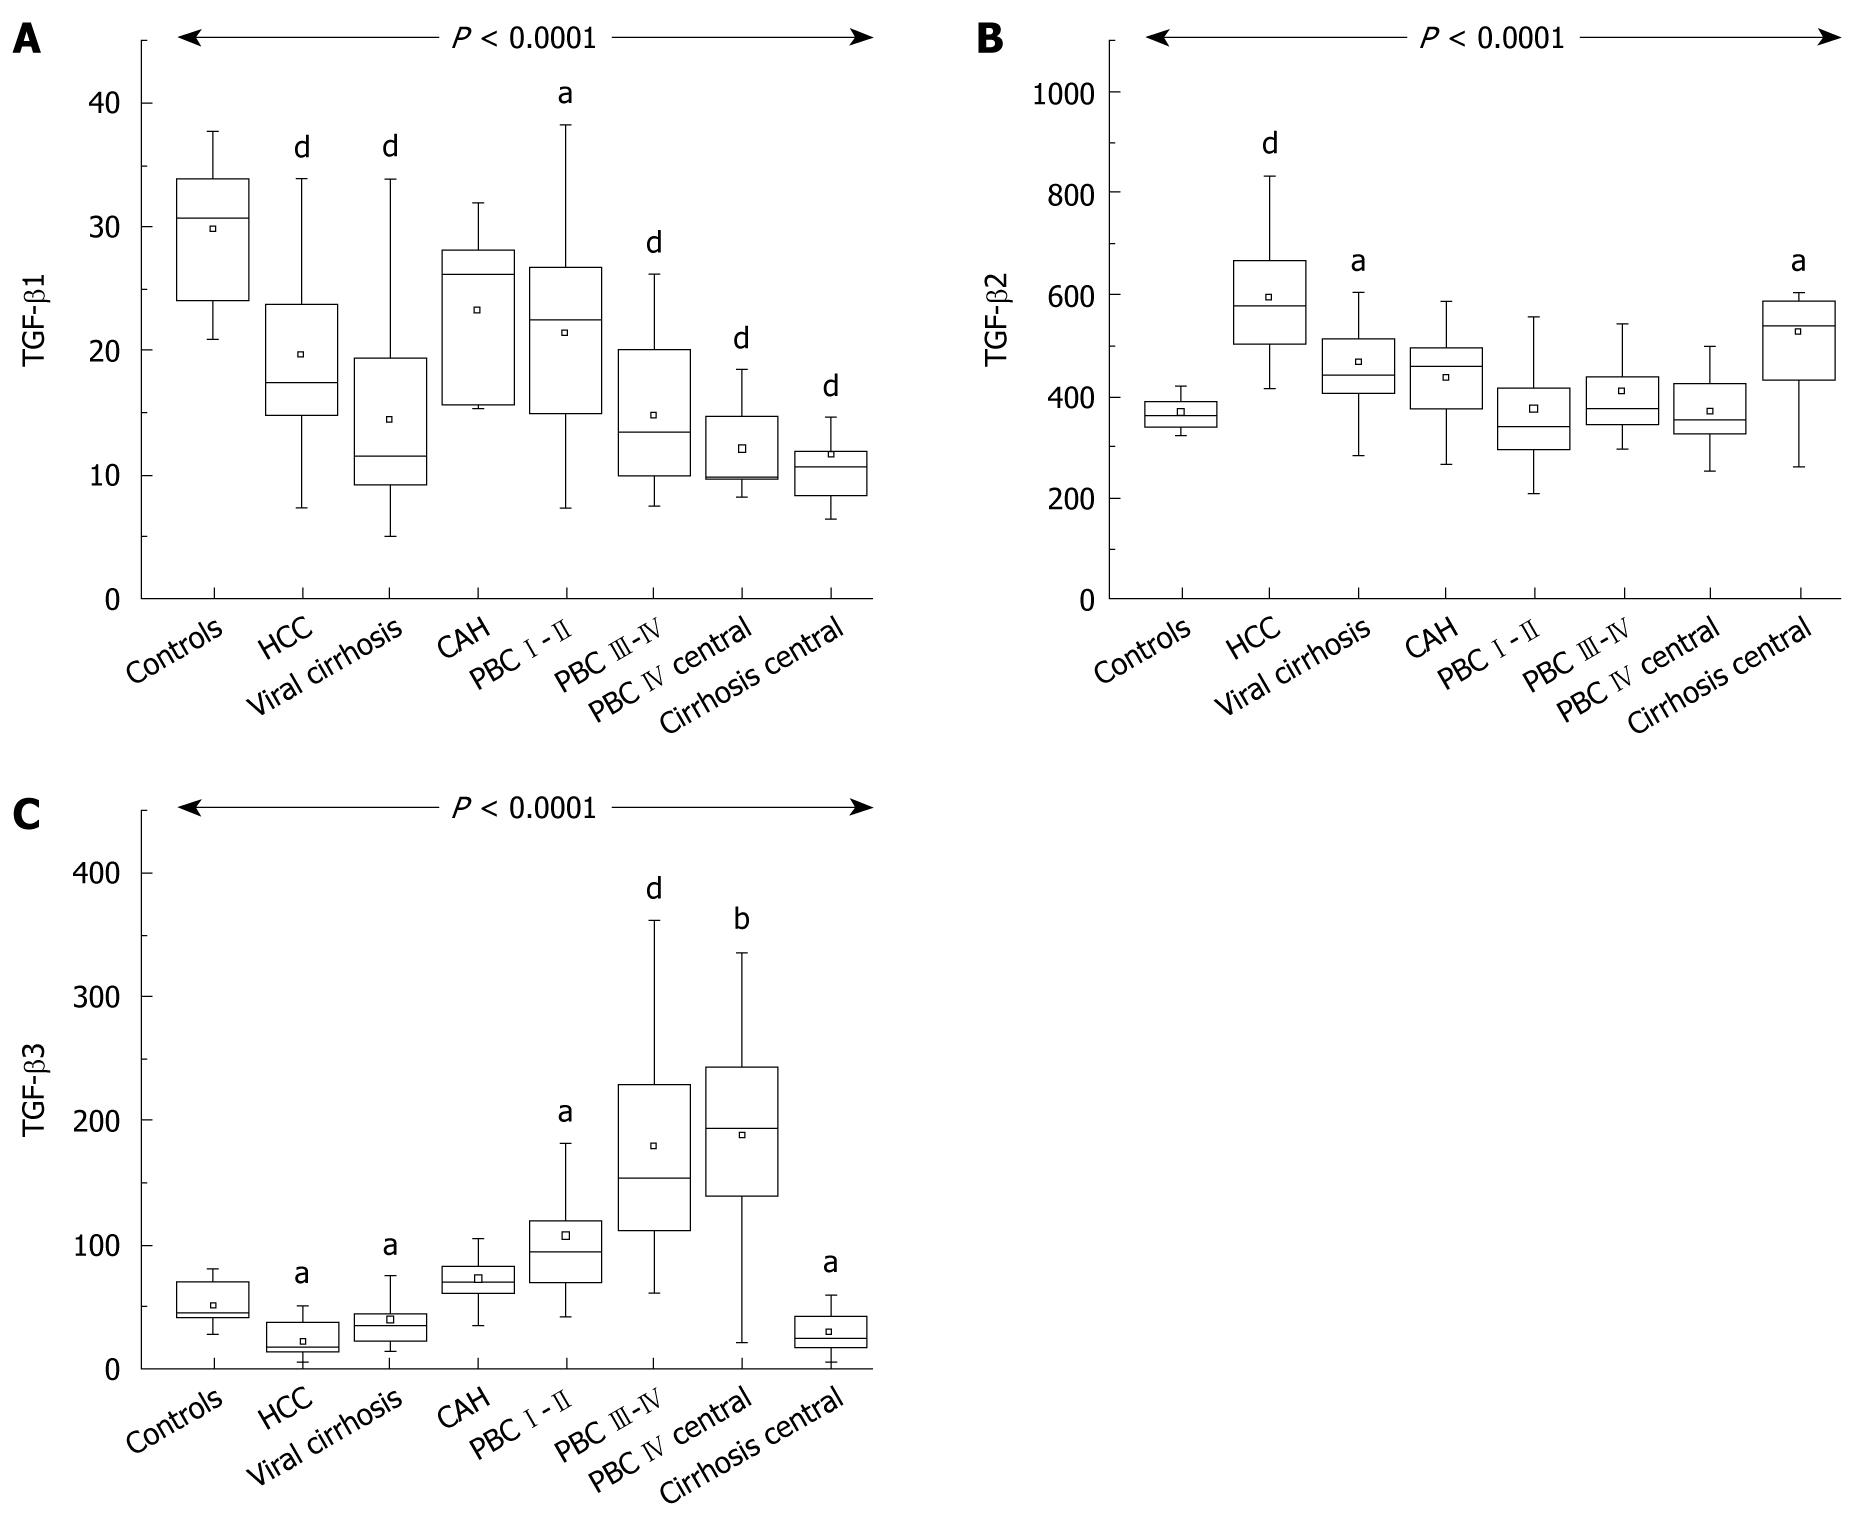
Figure 1 Transforming growth factor-β1 (A), transforming growth factor-β2 (B) and transforming growth factor-β3 (C).
A: Box plots showing the interquartile range (box), median (horizontal line) and range (vertical lines) of the serum levels of transforming growth factor-β1 (TGF-β1) in normal controls, patients with hepatocellular carcinoma (HCC), viral cirrhosis, chronic active hepatitis C (CAH), primary biliary cirrhosis (PBC) stages I-II, PBC stages III-IV, in hepatic vein blood from PBC and viral cirrhosis patients (central). B, C: Box plots showing the interquartile range (box), median (horizontal line) and range (vertical lines) in the peripheral and hepatic vein serum levels of TGF-β2 and TGF-β3 of the same group of patients. aP < 0.05, bP < 0.01, dP < 0.001.
- Citation: Voumvouraki A, Koulentaki M, Tzardi M, Sfakianaki O, Manousou P, Notas G, Kouroumalis E. Increased ΤGF-β3 in primary biliary cirrhosis: An abnormality related to pathogenesis? World J Gastroenterol 2010; 16(40): 5057-5064
- URL: https://www.wjgnet.com/1007-9327/full/v16/i40/5057.htm
- DOI: https://dx.doi.org/10.3748/wjg.v16.i40.5057


