Copyright
©2010 Baishideng Publishing Group Co.
World J Gastroenterol. Oct 28, 2010; 16(40): 5047-5056
Published online Oct 28, 2010. doi: 10.3748/wjg.v16.i40.5047
Published online Oct 28, 2010. doi: 10.3748/wjg.v16.i40.5047
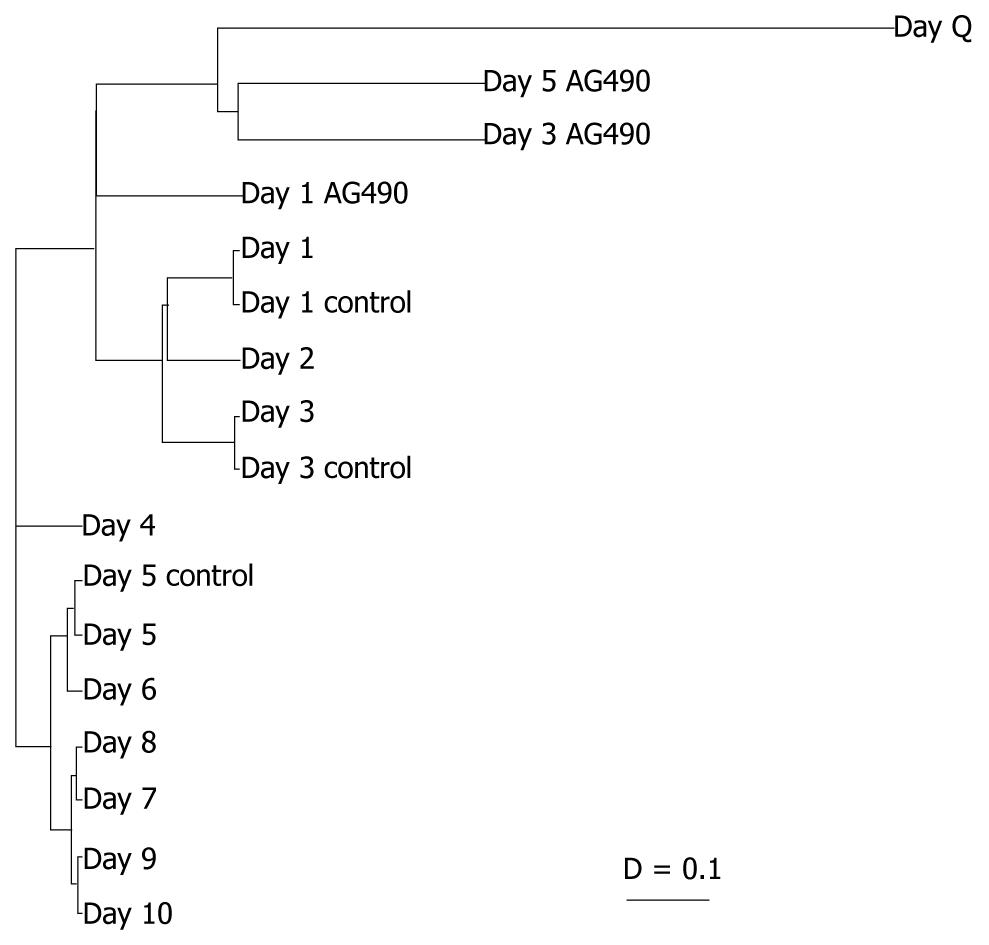
Figure 5 Inhibition of JAK/STAT signaling pathway: cluster analyses.
AMADA software was used to detect any relationships between the days in culture treated with or without AG490 over a five-day period. Distance relationships were calculated using Spearman rank correlation (D = 0-2). The shorter the distance between two genes, the more similar the expression profile over days in culture. Data from the treated cells (days 1, 3 and 5) were incorporated with the previous data for days in culture (day Q-day 10) to demonstrate days of similarity based on gene expression. The clustering showed that the gene expression profile of HSCs treated with AG490 was highly related to the expression profile of the day Q hepatic stellate cells.
- Citation: Lakner AM, Moore CC, Gulledge AA, Schrum LW. Daily genetic profiling indicates JAK/STAT signaling promotes early hepatic stellate cell transdifferentiation. World J Gastroenterol 2010; 16(40): 5047-5056
- URL: https://www.wjgnet.com/1007-9327/full/v16/i40/5047.htm
- DOI: https://dx.doi.org/10.3748/wjg.v16.i40.5047


