Copyright
©2010 Baishideng Publishing Group Co.
World J Gastroenterol. Oct 28, 2010; 16(40): 5047-5056
Published online Oct 28, 2010. doi: 10.3748/wjg.v16.i40.5047
Published online Oct 28, 2010. doi: 10.3748/wjg.v16.i40.5047
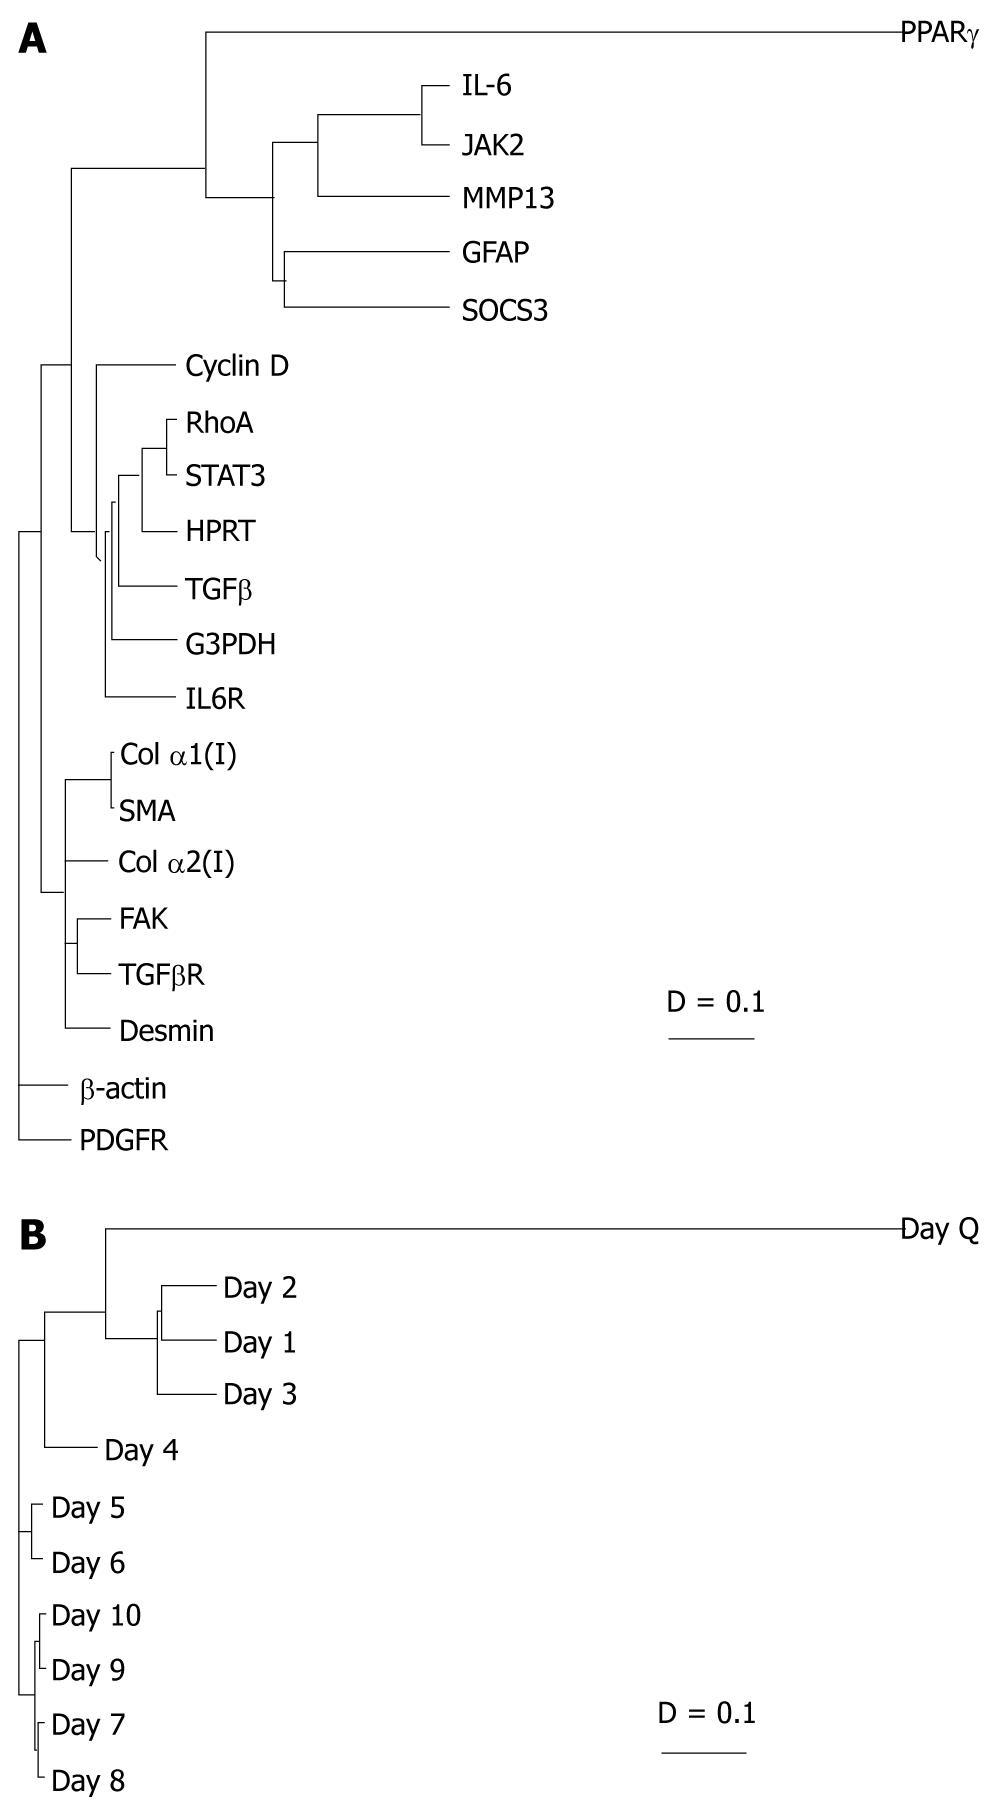
Figure 2 Clustered genetic and day analyses.
A: The genes were grouped based on the degree of relatedness in their expression patterns over time using AMADA software. Distance relationships were calculated using Spearman rank correlation (D = 0-2). The shorter the distance between two genes, the more similar the expression profile over days in culture; B: The clustering tree demonstrated which days in culture were most coordinately regulated. As expected, day Q branches alone, while culture-activated HSCs are more closely regulated. Unexpectedly, day 4 also branched alone. IL-6: Interleukin 6; SOCS: Suppressors of cytokine signaling protein; TGF: Transforming growth factor; STAT: Signal transducers and activators of transcription; PPAR: Peroxisome proliferator activated receptor; FAK: Focal adhesion kinase; JAK: Janus kinase 2; SMA: Smooth muscle α-actin; MMP: Matrix metalloproteinase.
- Citation: Lakner AM, Moore CC, Gulledge AA, Schrum LW. Daily genetic profiling indicates JAK/STAT signaling promotes early hepatic stellate cell transdifferentiation. World J Gastroenterol 2010; 16(40): 5047-5056
- URL: https://www.wjgnet.com/1007-9327/full/v16/i40/5047.htm
- DOI: https://dx.doi.org/10.3748/wjg.v16.i40.5047


