Copyright
copy;2010 Baishideng Publishing Group Co.
World J Gastroenterol. Oct 21, 2010; 16(39): 4973-4979
Published online Oct 21, 2010. doi: 10.3748/wjg.v16.i39.4973
Published online Oct 21, 2010. doi: 10.3748/wjg.v16.i39.4973
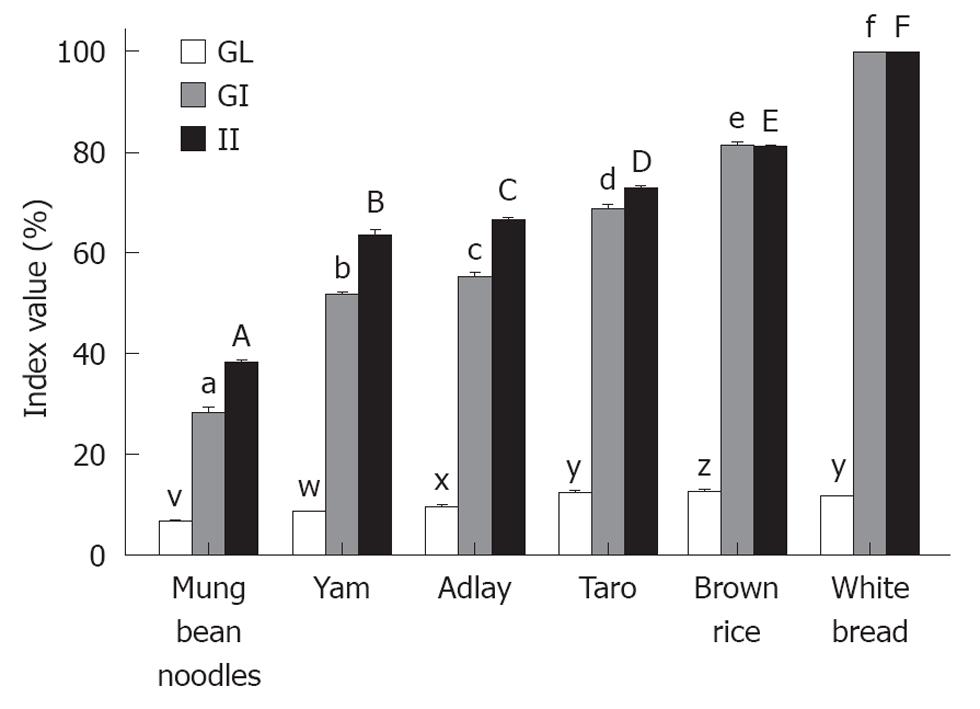
Figure 3 Glycemic index, glycemic load and insulinemic index values of the starchy foods.
The mean glycemic index (GI), glycemic load (GL) and insulinemic index (II) for the reference food (white bread) and the five tested starchy foods. For the GI values, columns with different superscripts (a, b, c, d, e, f) are significantly (P < 0.05) different. Columns representing the GL values with different superscripts (v, w, x, y, z) are significantly different (P < 0.05). Columns representing the II values with different superscripts (A, B, C, D, E, F) are significantly different (P < 0.05).
- Citation: Lin MHA, Wu MC, Lu S, Lin J. Glycemic index, glycemic load and insulinemic index of Chinese starchy foods. World J Gastroenterol 2010; 16(39): 4973-4979
- URL: https://www.wjgnet.com/1007-9327/full/v16/i39/4973.htm
- DOI: https://dx.doi.org/10.3748/wjg.v16.i39.4973


