Copyright
copy;2010 Baishideng Publishing Group Co.
World J Gastroenterol. Sep 28, 2010; 16(36): 4599-4604
Published online Sep 28, 2010. doi: 10.3748/wjg.v16.i36.4599
Published online Sep 28, 2010. doi: 10.3748/wjg.v16.i36.4599
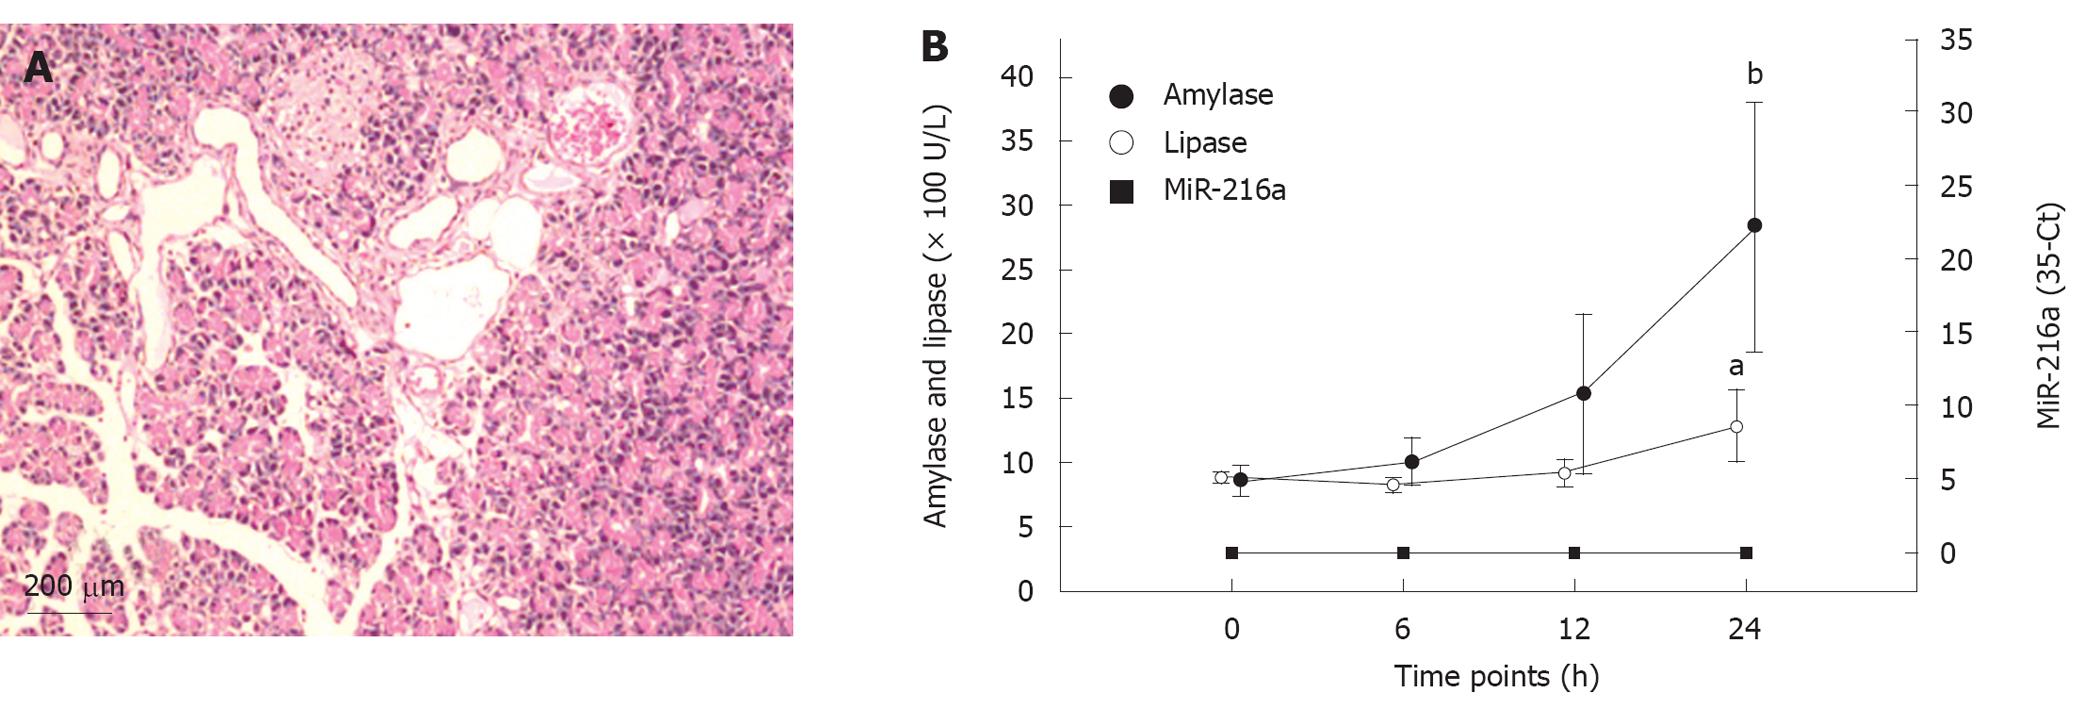
Figure 4 Amylase, lipase levels and light micrographs of pancreatic tissue in cecal ligation and puncture model.
A: Pancreatic tissue was normal in the cecal ligation and puncture (CLP) model; B: Plasma amylase and lipase were significantly elevated 24 h after induction of this model, while plasma miR-216a remained undetectable. Data are presented as the mean ± SD. Eight rats were studied throughout the experiment with the CLP model. aP < 0.05 vs 0 h time point; bP < 0.01 vs 0 h time point. Pairwise Bonferroni corrected t-tests.
- Citation: Kong XY, Du YQ, Li L, Liu JQ, Wang GK, Zhu JQ, Man XH, Gong YF, Xiao LN, Zheng YZ, Deng SX, Gu JJ, Li ZS. Plasma miR-216a as a potential marker of pancreatic injury in a rat model of acute pancreatitis. World J Gastroenterol 2010; 16(36): 4599-4604
- URL: https://www.wjgnet.com/1007-9327/full/v16/i36/4599.htm
- DOI: https://dx.doi.org/10.3748/wjg.v16.i36.4599


