Copyright
copy;2010 Baishideng Publishing Group Co.
World J Gastroenterol. Sep 28, 2010; 16(36): 4532-4540
Published online Sep 28, 2010. doi: 10.3748/wjg.v16.i36.4532
Published online Sep 28, 2010. doi: 10.3748/wjg.v16.i36.4532
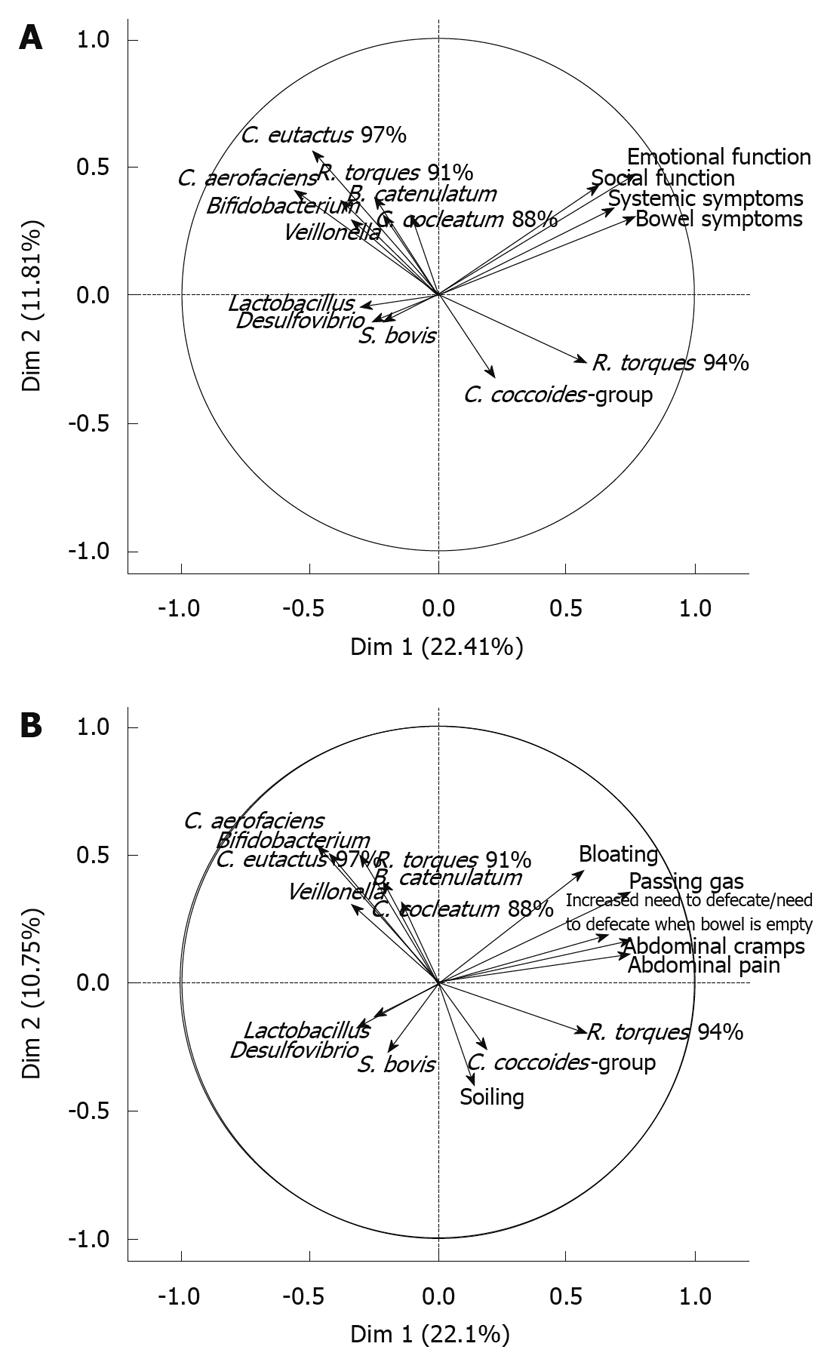
Figure 1 Principal component analysis of bacterial data and patient symptom scores.
A: Dimension 1 explains 20.4% of the observed variation among test subjects when bacterial data and symptom groups are studied. The four symptom groups have correlations with Dimension 1 of 0.77-0.63, all with P < 0.001, and Ruminococcus torques 94% has a correlation of 0.58, with P < 0.001. Coprococcus eutactus 97%, Bifidobacterium spp., Veillonella spp. and Desulfovibrio desulfuricans-group also present significant, albeit smaller, negative correlations with Dimension 1; B: When the bowel symptom sum is studied question-wise, individual symptoms (except for soiling) as well as Ruminococcus torques 94% show a significant correlation of 0.57-0.75, with P < 0.001, with Dimension 1. Negative associations are observed for Collinsella aerofaciens-like, Coprococcus eutactus 97%, Veillonella spp., Lactobacillus spp. and Bifidobacterium spp.
- Citation: Malinen E, Krogius-Kurikka L, Lyra A, Nikkilä J, Jääskeläinen A, Rinttilä T, Vilpponen-Salmela T, Wright AJV, Palva A. Association of symptoms with gastrointestinal microbiota in irritable bowel syndrome. World J Gastroenterol 2010; 16(36): 4532-4540
- URL: https://www.wjgnet.com/1007-9327/full/v16/i36/4532.htm
- DOI: https://dx.doi.org/10.3748/wjg.v16.i36.4532


