Copyright
©2010 Baishideng Publishing Group Co.
World J Gastroenterol. Sep 14, 2010; 16(34): 4329-4334
Published online Sep 14, 2010. doi: 10.3748/wjg.v16.i34.4329
Published online Sep 14, 2010. doi: 10.3748/wjg.v16.i34.4329
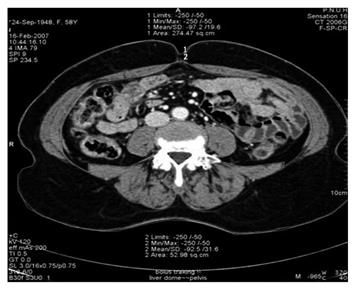
Figure 3 Calculation of the abdominal adipose tissue distribution using computed tomography scans.
The total adipose tissue (TAT) area was obtained by applying an adipose tissue threshold to a region of interest (ROI) that was traced around the dermis (1). An ROI was traced around the inner margin of the abdominal wall muscles, and an adipose tissue threshold was applied to determine the area of visceral adipose tissue (VAT) in the ROI (2). The subcutaneous adipose tissue area was then obtained by subtracting the VAT from the TAT.
- Citation: Choi CW, Kim GH, Kang DH, Kim HW, Kim DU, Heo J, Song GA, Park DY, Kim S. Associated factors for a hyperechogenic pancreas on endoscopic ultrasound. World J Gastroenterol 2010; 16(34): 4329-4334
- URL: https://www.wjgnet.com/1007-9327/full/v16/i34/4329.htm
- DOI: https://dx.doi.org/10.3748/wjg.v16.i34.4329


