Copyright
©2010 Baishideng Publishing Group Co.
World J Gastroenterol. Sep 14, 2010; 16(34): 4329-4334
Published online Sep 14, 2010. doi: 10.3748/wjg.v16.i34.4329
Published online Sep 14, 2010. doi: 10.3748/wjg.v16.i34.4329
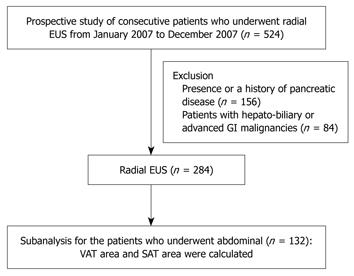
Figure 1 Flow chart indicating the progression from the initial assessment when first referred for endoscopic ultrasound to the final analysis.
EUS: Endoscopic ultrasound; GI: Gastrointestinal; VAT: Visceral adipose tissue; SAT: Subcutaneous adipose tissue.
- Citation: Choi CW, Kim GH, Kang DH, Kim HW, Kim DU, Heo J, Song GA, Park DY, Kim S. Associated factors for a hyperechogenic pancreas on endoscopic ultrasound. World J Gastroenterol 2010; 16(34): 4329-4334
- URL: https://www.wjgnet.com/1007-9327/full/v16/i34/4329.htm
- DOI: https://dx.doi.org/10.3748/wjg.v16.i34.4329


