Copyright
©2010 Baishideng Publishing Group Co.
World J Gastroenterol. Sep 14, 2010; 16(34): 4272-4280
Published online Sep 14, 2010. doi: 10.3748/wjg.v16.i34.4272
Published online Sep 14, 2010. doi: 10.3748/wjg.v16.i34.4272
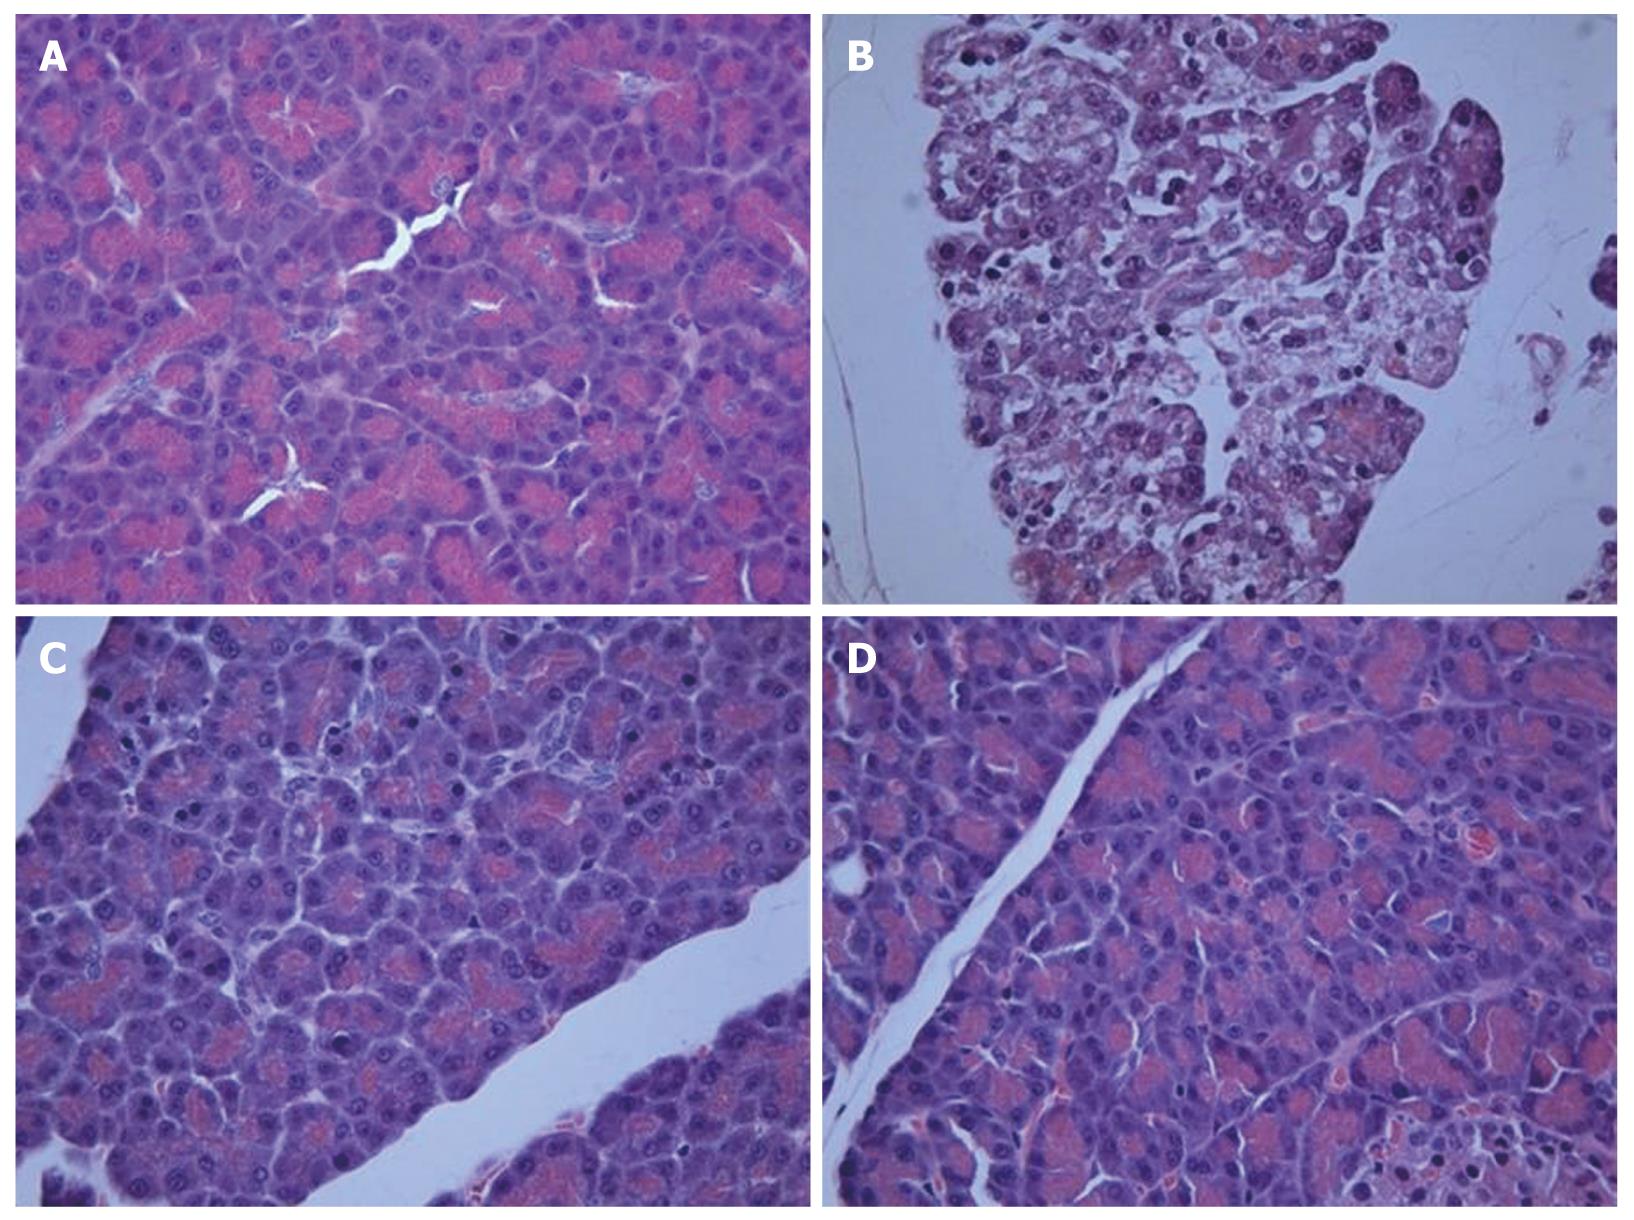
Figure 6 Representatives microphotographs of pancreatic sections (× 400).
A: Normal control group; B: Vehicle + L-arginine; C: α,β-amyrin (100 mg/kg) + L-arginine; D: Methylprednisolone (30 mg/kg) + L-arginine.
- Citation: Melo CM, Carvalho KMMB, Neves JCS, Morais TC, Rao VS, Santos FA, Brito GAC, Chaves MH. α,β-amyrin, a natural triterpenoid ameliorates L-arginine-induced acute pancreatitis in rats. World J Gastroenterol 2010; 16(34): 4272-4280
- URL: https://www.wjgnet.com/1007-9327/full/v16/i34/4272.htm
- DOI: https://dx.doi.org/10.3748/wjg.v16.i34.4272


