Copyright
©2010 Baishideng.
World J Gastroenterol. Aug 21, 2010; 16(31): 3897-3904
Published online Aug 21, 2010. doi: 10.3748/wjg.v16.i31.3897
Published online Aug 21, 2010. doi: 10.3748/wjg.v16.i31.3897
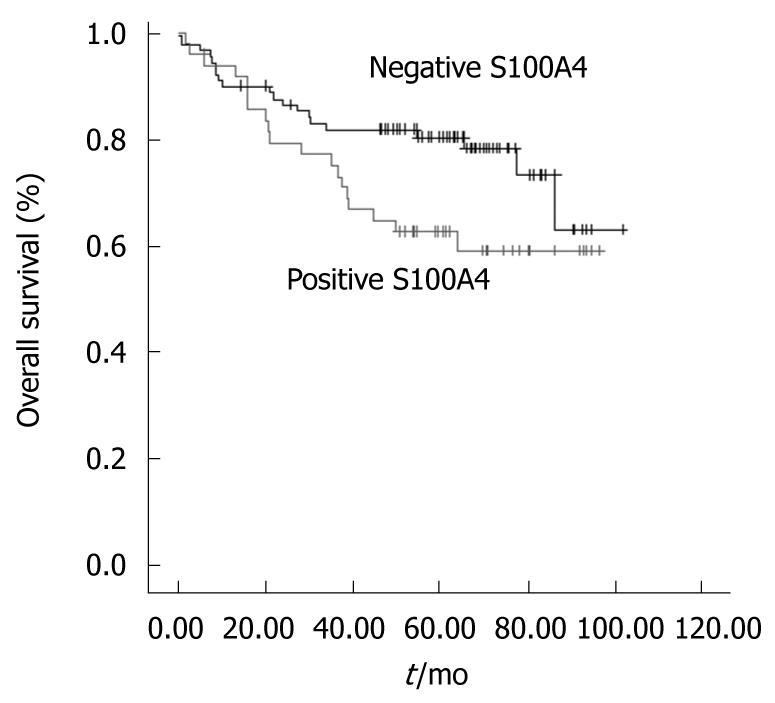
Figure 4 Kaplan-Meier survival curves demonstrating statistically significant differences according to the expression of protein S100A4 (log-rank test, P = 0.
044). Censored observations are shown as tick marks.
- Citation: Kwak JM, Lee HJ, Kim SH, Kim HK, Mok YJ, Park YT, Choi JS, Moon HY. Expression of protein S100A4 is a predictor of recurrence in colorectal cancer. World J Gastroenterol 2010; 16(31): 3897-3904
- URL: https://www.wjgnet.com/1007-9327/full/v16/i31/3897.htm
- DOI: https://dx.doi.org/10.3748/wjg.v16.i31.3897


